You can use intersection segments:
\documentclass[margin=5pt]{standalone}
\usepackage{pgfplots}
\pgfplotsset{compat=1.11}
\usepgfplotslibrary{fillbetween}
\begin{document}
  \begin{tikzpicture}
%
    \pgfdeclarelayer{pre main}
    \pgfsetlayers{pre main,main}
%
    \begin{axis}[axis equal,no markers,hide axis,samples=100]
      \addplot+[domain=360:0,name path=k1] ({1.5*cos(x)},{1.5*sin(x)});
      \addplot+[domain=360:0,name path=k2] ({cos(x) + 2},{sin(x)});
%
      \begin{pgfonlayer}{pre main}
        \fill [orange!50,
          intersection segments={
            of=k1 and k2,
            sequence={L0--L1--R2}
          }];
      \end{pgfonlayer}
%
    \end{axis}
  \end{tikzpicture}
\end{document}

To show the intersection segments:

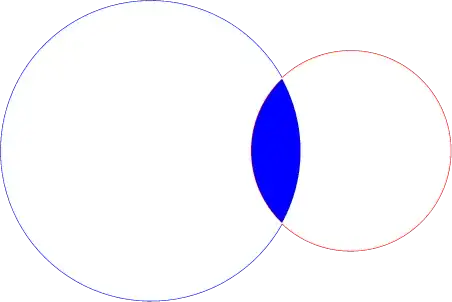
So the green (L0), orange (L1) and yellow (R2) segments are needed in the sequence to fill the intersection of the two cirles.
Code:
\documentclass[margin=5pt]{standalone}
\usepackage{pgfplots}
\pgfplotsset{compat=1.11}
\usepgfplotslibrary{fillbetween}
\begin{document}
  \begin{tikzpicture}
    \pgfdeclarelayer{pre main}
  \pgfsetlayers{pre main,main}
    \begin{axis}[axis equal,no markers,hide axis,samples=100]
      \addplot+[domain=360:0,name path=k1] ({1.5*cos(x)},{1.5*sin(x)});
      \addplot+[domain=360:0,name path=k2] ({cos(x) + 2},{sin(x)});
%
      \begin{scope}[line width=2pt]
        \foreach[count=\i from 0] \c in {green,orange,purple}{
          \edef\temp{\noexpand\draw [\c,
            intersection segments={of=k1 and k2,sequence={L\i}}]node[right]{L\i};}
          \temp}
        \foreach[count=\i from 0] \c in {blue,gray,yellow}{
          \edef\temp{\noexpand\draw [\c,
            intersection segments={of=k1 and k2,sequence={R\i}}]node[left]{R\i};}
          \temp}
      \end{scope}
%
  \end{axis}
  \end{tikzpicture}
\end{document}