Ok, I've made the following diagram:
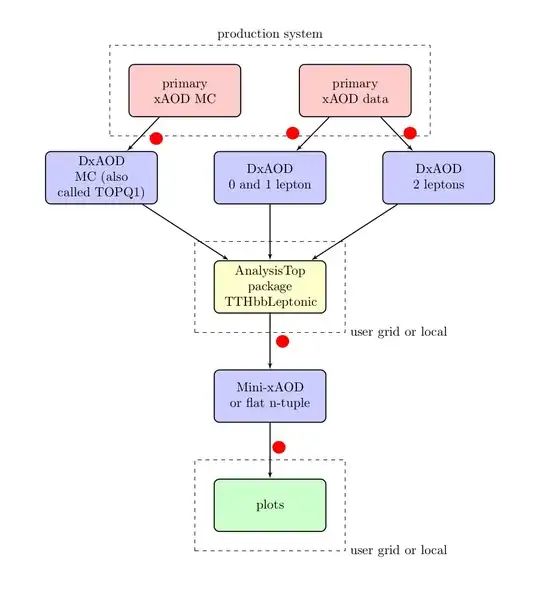
I want to add text labels to the various arrows (at the red points) and I want to ensure that the labels do not overlap the dotted lines, the arrow lines etc. So,
- What is a good way to add labels to the lines (hopefully compatible with the way I've coded the lines)?
- What is a good way to move the rectangles such that conflicts between the text of the labels and the lines of the rectangles and arrows are avoided?
The code is as follows:
\documentclass{article}
\usepackage{tikz}
\usetikzlibrary{fit, arrows, calc, positioning}

\begin{document}

\tikzstyle{redRectangle} = [
    rectangle,
    draw,
    fill=red!20,
    node distance=0.65 cm,
    text width=7 em,
    text centered,
    rounded corners,
    minimum height=4 em,
    minimum width=3 cm,
    thick
]

\tikzstyle{blueRectangle} = [
    rectangle,
    draw,
    fill=blue!20,
    node distance=1.5 cm,
    text width=7 em,
    text centered,
    rounded corners,
    minimum height=4 em,
    minimum width=3 cm,
    thick
]

\tikzstyle{yellowRectangle} = [
    rectangle,
    draw,
    fill=yellow!20,
    node distance=1.5 cm,
    text width=7 em,
    text centered,
    rounded corners,
    minimum height=4 em,
    minimum width=3 cm,
    thick
]

\tikzstyle{greenRectangle} = [
    rectangle,
    draw,
    fill=green!20,
    node distance=1.5 cm,
    text width=7 em,
    text centered,
    rounded corners,
    minimum height=4 em,
    minimum width=3 cm,
    thick
]

\tikzstyle{blueDiamond} = [
    diamond,
    draw,
    fill=blue!20,
    node distance=1.5 cm,
    text width=7 em,
    text badly centered,
    inner sep=0pt,
    thick
]

\tikzstyle{blueEllipse} = [
    ellipse,
    draw,
    fill=blue!20,
    node distance=1.5 cm,
    text width=7 em,
    thick
]

\tikzstyle{container} = [
    rectangle,
    draw,
    inner sep=0.5 cm,
    dashed
]

\tikzstyle{empty} = [
]

\tikzstyle{line} = [
    draw,
    -latex',
    thick
]

\begin{tikzpicture}[auto]

    \node [empty](origin){};
    \node [redRectangle, right=of origin] (primaryxAODData) {primary xAOD data};
    \node [redRectangle, left=of origin] (primaryxAODMC) {primary xAOD MC};
    \node [blueRectangle, below=of origin](DxAOD0And1Lepton){DxAOD\\0 and 1 lepton};
    \node [blueRectangle, left=of DxAOD0And1Lepton] (DxAODMC) {DxAOD\\MC (also called TOPQ1)};
    \node [blueRectangle, right=of DxAOD0And1Lepton](DxAOD2Leptons){DxAOD\\2 leptons};
    \node [yellowRectangle, below=of DxAOD0And1Lepton](AnalysisTopPackage){AnalysisTop package\\TTHbbLeptonic};
    \node [blueRectangle, below=of AnalysisTopPackage](Mini-xAODorflatn-tuple){Mini-xAOD or flat n-tuple};
    \node [greenRectangle, below=of Mini-xAODorflatn-tuple](plots){plots};

    \node [container, fit=(primaryxAODData)(origin)(primaryxAODMC)](container1){};
    \node [container, fit=(AnalysisTopPackage)](container2){};
    \node [container, fit=(plots)](container3){};

    \path [line] (primaryxAODMC) -- (DxAODMC);
    \path [line] (primaryxAODData) -- (DxAOD0And1Lepton);
    \path [line] (primaryxAODData) -- (DxAOD2Leptons);

    \path [line] (DxAODMC) -- (AnalysisTopPackage);
    \path [line] (DxAOD0And1Lepton) -- (AnalysisTopPackage);
    \path [line] (DxAOD2Leptons) -- (AnalysisTopPackage);

    \path [line] (AnalysisTopPackage) -- (Mini-xAODorflatn-tuple);
    \path [line] (Mini-xAODorflatn-tuple) -- (plots);

    \node at (container1.north)[above]{production system};
    \node at (container2.south east)[right]{user grid or local};
    \node at (container3.south east)[right]{user grid or local};

\end{tikzpicture}

\end{document}

Would you happen to know if there is a more automated approach to creating diagrams like this in TikZ (so that I wouldn't have to edit sizes and whatnot in order to avoid overlap of elements)?
– d3pd Mar 02 '15 at 11:09matrixnodes can help you when the diagram has a regular distribution, but distance between nodes and where to place labels is always up to your criteria. – Ignasi Mar 02 '15 at 11:29