0

the source
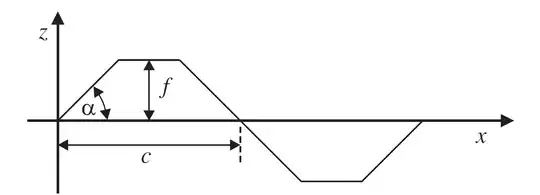
I was trying to edit a diagram and add a dimension line , as you see in the attached image,but I could not reach the arrows appropriate to draw the same arrow, if it's possible to do that in Latex , I have no Idea how to, could someone help me ? I am reading these links : here and here but still I don't get it how I can draw a straight line and ...the image

I have tried for the code so far I can not draw the arrow with two heads, it appears only one head in one end of the middle like beside which you see the letter f , I still don't know how to write the letter beside the line:

\documentclass[11pt,a4paper,twoside,openright]{report}
\usepackage{tikz}
\usetikzlibrary{calc,intersections,through,backgrounds}
\begin{document}
\begin{tikzpicture}[--, thick]
\draw  (-10,0) -- (-9,1);
\draw  (-9,1) -- (-7.5,1);
\draw  (-7.5,1) -- (-6.5,0);
\draw  (-6.5,0) -- (-5.5,-1);
\draw  (-5.5,-1)-- (-4,-1);
\draw  (-4,-1)-- (-3,0);
%dimensions
\draw  [|<->|] (-8.25,0) -- (-8.25,1);
\draw  [|<->|] (-10,-0.5) -- (-6.5,-0.5);
\begin{scope}[dash pattern=on 2pt off 3pt on 4pt off 4pt];
\draw[dashed] (-6.5pt,0pt) -- (-6.5pt,-1pt);
\end{scope}
\begin{scope}[ultra thick]
\draw [->] (-10.5,0) -- (-1.5,0);
\draw [->] (-10,-1.5) -- (-10,1.5);
\end{scope}
\end{tikzpicture}
\end{document}
Farzad64
  • 379
  • The Format is .jpg – Farzad64 Apr 05 '15 at 13:41
  • I think it must be hard from within LaTeX. If you only have a few simple diagrams like the one you posted, probably you should reproduce it with one of the LaTeX graphics packages. – Bernard Apr 05 '15 at 13:46
  • What is the code you're using to try and draw on the existing diagram? – darthbith Apr 05 '15 at 14:21
  • I still don't know which code can do that, I noticed in LateX tikZ is used, I have the source of the image , I only tried to edit the above dimension line : Cp , but the dimension line is not similar to the others , I wanted to know if there is a similar dimension line in Latex and packages, and if it's possible to insert it there ? – Farzad64 Apr 05 '15 at 14:25
  • I mean how did you add Cp line. if i understand you need some thing like \draw[<->, >=triangle 60](0,0)--(0,2); – touhami Apr 05 '15 at 15:03
  • ah, I didn't add it with a code, but now , I want to do it by LateX, I used OneNote – Farzad64 Apr 05 '15 at 15:05
  • 3
    Please show us how you tried to apply the strategies in one of the links you posted and explain the problem you are having applying them in this case. For example, the answers here have seemed clear to me and I've applied the ideas successfully to other cases. So it would be helpful for me to understand what exactly you are having trouble with. As has been said before, this is not a do-my-work-for-me site. People are happy to help, but you need to make an effort to learn some basics, too. – cfr Apr 05 '15 at 15:46
  • 1
    You haven't posted anything you've tried. Drawing a straight line is pretty much the single simplest thing you can do with TiKZ. But you haven't given us anything: not the code to include the picture, not the straight line, not any kind of arrow. You said the problem was that you couldn't get the same kind of arrow. Post the one you've got and somebody can easily suggest a more appropriate arrow tip from arrows.meta, for example. Every task is different, of course. But, the point is: it is your task. Not ours. Don't expect this site to do everything for you. – cfr Apr 05 '15 at 17:58
  • thank you but the image is not drawn by a code ! – Farzad64 Apr 05 '15 at 18:01
  • I think with Tikz, it's possible to draw the whole picture , right ? it's not possible to add something to an existing image – Farzad64 Apr 05 '15 at 18:39
  • The command \draw<->, >=triangle 60--(0,2); did not create the head of the arrow, it just made a line – Farzad64 Apr 05 '15 at 20:47

2 Answers2

5

This demonstrates how to add labels to lines and how to get the dashed line in the right place. Note that (6.5pt,0.5pt) is not generally the same as (6.5,0.5)! I've also simplified your path specification a bit and removed the non-working option to tikzpicture.

  • midway puts the label halfway, which is wanted for the f and c.
  • pos=.95 puts the label 95% of the way to the end point, which is wanted for the labels on the axes.
  • left and below specify the relative position of the label with respect to the line.

Code

\documentclass[tikz,border=10pt]{standalone}
\begin{document}
\begin{tikzpicture}[thick]
    \draw  (-10,0) -- (-9,1)  -- (-7.5,1) -- (-6.5,0)  -- (-5.5,-1) -- (-4,-1) -- (-3,0);
    %dimensions
    \draw  [<->] (-8.25,0) -- (-8.25,1) node [midway, right] {$f$};
    \draw  [<->] (-10,-0.5) -- (-6.5,-0.5) node [midway, below] {$c$};
    \draw [dashed] (-6.5,0) -- (-6.5,-.75);
    \begin{scope}[ultra thick]
      \draw [->] (-10.5,0) -- (-1.5,0) node [pos=.95, below] {$x$};
      \draw [->] (-10,-1.5) -- (-10,1.5) node [pos=.95, left] {$y$};
    \end{scope}
\end{tikzpicture}
\end{document}

labelled lines

cfr
  • 198,882
4

JPEG is a quite worse format for drawings. Therefore it is better to redraw the image. The following example uses TikZ. The function is strictly drawn using the parameters f, c, α (\fHeight, \cWidth, \alphaAngle).

\documentclass{article}
%\usepackage{graphicx}
\usepackage{tikz}
\usetikzlibrary{arrows.meta}
\usetikzlibrary{bending}
\pagestyle{empty}

\begin{document}
  \setlength{\unitlength}{.5mm}
  \begin{tikzpicture}[
    x=\unitlength,
    y=\unitlength,
    >=Triangle,
  ]
    \def\fHeight{17}
    \def\cWidth{50}
    \def\alphaAngle{45}
    \def\alphaRadius{14}
    % Image as background as help for redrawing
    % \node[
    %   inner sep=0pt,
    %   above right,
    % ] at (-16.25, -20.75)
    %   {\includegraphics[width=150\unitlength]{QpYZE.jpg}}
    % ;

    % Coordinate axes
    \begin{scope}[
      thick,
      ->,
    ]
      \draw (-9, 0) -- (125, 0) node[below left, xshift=-.5em] {$x$};
      \draw (0, -20) -- (0, 30) node[below left, yshift=-.25em] {$z$};
    \end{scope}

    % Function
    \pgfmathsetmacro{\xf}{\fHeight * cot(\alphaAngle)}
    \draw[
      semithick,
    ]
      (0, 0)
      -- (\xf, \fHeight) coordinate (A)
      -- (\cWidth - \xf, \fHeight) coordinate (B)
      -- (\cWidth + \xf, -\fHeight)
      -- (2*\cWidth - \xf, -\fHeight)
      -- (2*\cWidth, 0)
    ;

    % Annotations
    \begin{scope}[
      thin,
      <->,
      shorten <=.4pt,
    ]
      \draw[shorten >=.3pt]
        (\cWidth/2, 0) -- node[right] {$f$} ++(0, \fHeight)
      ;
      \draw[shorten >=.2pt]
        (0, -6) -- node[below] (c) {$c$} ++(\cWidth, 0)
      ;
      \draw[shorten <=.2pt, shorten >=.2pt]
        (\xf, \fHeight + 4) -- node[above] (cp) {$c_p$}
        (\cWidth - \xf, \fHeight + 4)
      ;
      \draw[shorten >=.3pt, radius=\alphaRadius]
        (\alphaRadius, 0) arc[start angle=0, end angle=\alphaAngle]
      ;
      \node at (\alphaAngle/2:.65*\alphaRadius) {$\alpha$};
    \end{scope}

    % Help lines
    \draw[thin, densely dashed]
      (\cWidth, 0) -- (\cWidth, 0 |- c.south)
      (A) -- (A |- cp.north)
      (B) -- (B |- cp.north)
    ;
  \end{tikzpicture}
\end{document}

Result

Heiko Oberdiek
  • 271,626