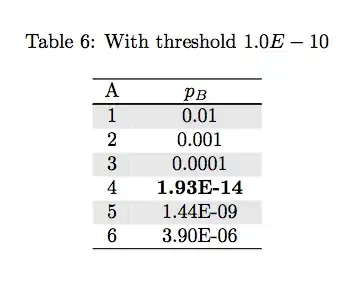
Following advice seen in other entries about using pgfplotstable on tex.stackexchange.com (such as pgfplotstable: Conditional post-processing of cell content on a per-column basis), I have encountered the puzzling behavior seen below, where I can successfully bold p-values less than 1x10^-4 (see Table 1 image), but the exact same code fails to work if I try to bold only p-values less than 1x10^-5 (see Table 3 image).
\documentclass{article}

\usepackage{pgfplotstable}
\usepackage{longtable}
\usepackage{caption}
\usepackage{colortbl}
\definecolor{lightgray}{gray}{0.9}
\usepackage{filecontents}
\begin{filecontents*}{test.csv}
A, B
1, 0.01
2, 0.001
3, 0.0001
4, 1.93E-14
5, 1.44E-09
6, 3.90E-06
\end{filecontents*}

\pgfplotstableread[col sep=comma]{test.csv}\mytable

\begin{document}
\captionof{table}{With threshold $1.0E-04$}
\newcolumntype{C}{>{\centering\arraybackslash}p{17mm}}
\pgfplotstabletypeset[
begin table=\begin{longtable},
end table=\end{longtable},
column type=C,
every even row/.style={
before row={\rowcolor[gray]{0.9}}},
every head row/.style={before row=\hline,after row=\hline\hline},
every last row/.style={after row=\hline},
columns/A/.style={column type=c},
columns/B/.style={column type=c,column name=$p_{B}$,
  postproc cell content/.style={
      /pgfplots/table/@cell content/.initial={}{%
% However, all calculations must not exceed ±16383.99999 at any point.
 % Scientific notation in the form 1.234e+4 is recognized.
 % The exponent symbol can be upper or lower case (i.e., E or e).
      \pgfmathparse{int(less(##1,1.0E-04))}
       \ifnum\pgfmathresult=1
           \textbf{##1}
           \else
             {##1}
            \fi
      },
    },
},
     col sep=comma,
     string type]\mytable

\captionof{table}{With threshold $1.0E-05$}
\newcolumntype{C}{>{\centering\arraybackslash}p{17mm}}
\pgfplotstabletypeset[
begin table=\begin{longtable},
end table=\end{longtable},
column type=C,
every even row/.style={
before row={\rowcolor[gray]{0.9}}},
every head row/.style={before row=\hline,after row=\hline\hline},
every last row/.style={after row=\hline},
columns/A/.style={column type=c},
columns/B/.style={column type=c,column name=$p_{B}$,
  postproc cell content/.style={
      /pgfplots/table/@cell content/.initial={}{%
      \pgfmathparse{int(less(##1,1.0E-05))}
       \ifnum\pgfmathresult=1
           \textbf{##1}
           \else
             {##1}
            \fi
      },
    },
},
     col sep=comma,
     string type]\mytable

\end{document}


\pgfmathparse{int(less(100*##1,1.0E-04))}– Daniel Weeks Apr 15 '15 at 22:20longtable. To avoid this, instead uselongtable*from thecaptionpackage as described here – Daniel Weeks Apr 27 '15 at 18:26