4

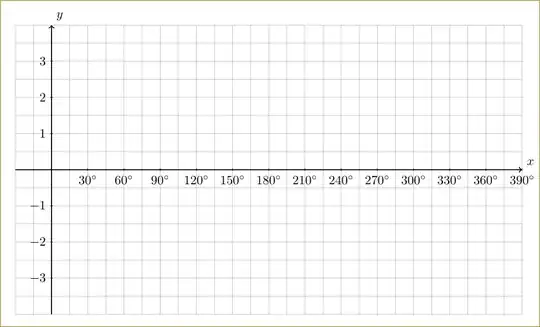
I have the following code to create an axis on which trigonometric functions must be plotted (in degrees). It is to be printed out and used as part of a mathematics test paper. However, x axis must be in step sizes of 30 degrees.

How can I modify the code below that each label on my x-axis, is multiplied by 30? I.e. the labels must be 0; 30; 60; 90; 120; ... etc

\documentclass[paper=a4, fontsize=11pt]{scrartcl}
\usepackage{tikz}
\usepackage{amsmath,amsfonts,amsthm}
\usepackage{gensymb}

\begin{document}
\begin{tikzpicture}
\draw[step = 0.5 cm, gray, very thin] (-1, -4) grid ( 13, 4);
\draw[thick, ->] (-1,0) -- (13,0) node[anchor = north west] {$x$};
\draw[thick, ->] (0,-4) -- (0,4) node[anchor = south east] {$y$};
\foreach \x in {1,...,13}
   \draw (\x cm, 1pt) -- (\x cm, -1pt) node[anchor = north] {$\x \degree$};
\foreach \y in {-3,..., 3}
   \draw (1pt, \y cm) -- (-1pt, \y cm) node[anchor = east] {$\y$};
\end{tikzpicture}

\end{document}

enter image description here

user860374
  • 1,165
  • 1
    are you unable/would it not be easier to use the pgfplots package for this? – aeroNotAuto May 03 '15 at 16:25
  • 1
    @aeroNotAuto - I would use pgfplots if I want to plot a function :). I am setting up a test paper, so only need an axis to provide in the paper for students to sketch a graph on :). So basically I'm only looking to create an axis grid with labels :) – user860374 May 03 '15 at 16:34
  • Do not use cm inside coordinate specification if you want to refer to the PGF coordinate system (with dimensions you access the paper coordinate system). See the x and the y key in the PGF/TikZ manual. (The default is x=1cm and y=1cm). That being said, you can also use \draw[x=1cm/30] \foreach \x in {30,60,...,360} {(\x, 1pt) -- (\x, -1pt) node[anchor = north] {$\x \degree$}};. (I moved the \foreach inside the path so that the calculation and transformation of x=1cm/30 is only done once.) – Qrrbrbirlbel May 03 '15 at 21:47

4 Answers4

6

I slightly changed your \foreach statement to include [evaluate=\x as \degree using int(\x*30)] and $\degree^\circ$ to print degrees. You can change the steps by changing the number 30.

Output

degree figure

Code

\documentclass[margin=10pt]{standalone}
\usepackage{amsmath,amsfonts,amsthm}
\usepackage{gensymb}
\usepackage{tikz}

\begin{document}
\begin{tikzpicture}
\draw[step = 0.5 cm, gray, very thin] (-1, -4) grid ( 13, 4);
\draw[thick, ->] (-1,0) -- (13,0) node[anchor = north west] {$x$};
\draw[thick, ->] (0,-4) -- (0,4) node[anchor = south east] {$y$};

\foreach \x [evaluate=\x as \degree using int(\x*30)] in {1,...,12}{ 
   \draw (\x cm, 1pt) -- (\x cm, -1pt) node[anchor = north] {$\degree^\circ$};
   }
\foreach \y in {-3,-2,-1,1,2,3}
   \draw (1pt, \y cm) -- (-1pt, \y cm) node[anchor = east] {$\y$};
\end{tikzpicture}
\end{document}
Alenanno
  • 37,338
  • I removed the 0 label mark because it was in the way, but if you want it, I can add it slightly above or below so it's not in the middle of the x axis. :) – Alenanno May 03 '15 at 17:28
3

You can use \pgfmathparse to multiply. Since you get the decimals, you may need int also like

node[anchor = north] {\pgfmathparse{int(30*\x)}$\SI{\pgfmathresult}{\degree}$};

Note that I have used siunitx for the degrees.

\documentclass{article}
\usepackage{tikz}
\usepackage{siunitx}
\begin{document}
  \begin{tikzpicture}
\draw[step = 0.5 cm, gray, very thin] (-1, -4) grid ( 13, 4);
\draw[thick, ->] (-1,0) -- (13,0) node[anchor = south west] {$x$};
\draw[thick, ->] (0,-4) -- (0,4) node[anchor = south west] {$y$};
\foreach \x in {1,...,13}
   \draw (\x cm, 1pt) -- (\x cm, -1pt) node[anchor = north] {\pgfmathparse{int(30*\x)}$\SI{\pgfmathresult}{\degree}$};
\foreach \y in {-3,-2,-1,1,2, 3}
   \draw (1pt, \y cm) -- (-1pt, \y cm) node[anchor = east] {$\y$};
\end{tikzpicture}
\end{document}

enter image description here

2

A way of doing this with MetaPost, for whom it may interest. Mainly a question of choosing the relevant scale for the x-axis, and of allowing a loop inside the labels of this axis, thanks to the \mplibtextextlabel{enable} instruction in the preamble. This makes the string arguments of each label commands be typeset by (Lua)LaTeX through the textext macro, much more flexible than the usual btex … etex flags.

\documentclass[border=2mm]{standalone}
\usepackage{siunitx}
\usepackage{luamplib}
  \mplibtextextlabel{enable}
\begin{document}
  \begin{mplibcode}
    numeric u, v, xmin, xmax, xstep, ymin, ymax, ystep; 
    u = cm/30; xmin = -30; xmax = 390; xstep = 15; 
    v = cm; ymax = 4 = -ymin; ystep = .5;
    beginfig(1);
      % Grid
      drawoptions(withcolor .8white);
      for i = ceiling(xmin/xstep) upto floor(xmax/xstep):
        draw ((i*xstep, ymin) -- (i*xstep, ymax)) xscaled u yscaled v;
      endfor
      for j = ceiling(ymin/ystep) upto floor(ymax/ystep):
        draw ((xmin, j*ystep) -- (xmax, j*ystep)) xscaled u yscaled v;
      endfor
      drawoptions(); labeloffset := 5bp;
      % x-axis marks and labels
      for i = 2xstep step 2xstep until xmax-2xstep:
        if i<>0: 
          label.bot("$" & decimal i & "\si\degree$", (i*u, 0)); 
          draw (i*u, -2bp) -- (i*u, 2bp);
        fi
      endfor
      % y-axis marks and labels
      for j = ymin+1 step 2ystep until ymax-1:
        if j<>0:
          draw(-2bp, j*v) -- (2bp, j*v);
          label.lft("$" & decimal j & "$", (0, j*v));
        fi  
      endfor 
      % Axes and other labels
      drawarrow (xmin*u, 0) -- (xmax*u, 0);
      drawarrow (0, ymin*v) -- (0, ymax*v);
      labeloffset := 3bp; label.llft("$O$", origin); 
      label.bot("$x$", (xmax*u, 0)); label.lft("$y$", (0, ymax*v));
    endfig;
  \end{mplibcode}
\end{document}

To be typeset with LuaLaTeX. Output:

enter image description here

Franck Pastor
  • 18,756
1

A PSTricks solution:

\documentclass{article}

\usepackage[margin = 3cm]{geometry}
\usepackage{pst-plot}
\usepackage{siunitx}
\usepackage{xfp}

\makeatletter
  \def\pst@@@hlabel#1{\ang{\fpeval{30*#1}}}
\makeatother

\begin{document}

\begin{pspicture*}(-1,-4)(13.36,4.4)
  \psgrid[subgriddiv = 2, gridcolor = lightgray](-1,-4)(12.9,3.9)
  \psaxes{->}(0,0)(-0.99,-3.99)(13,4)[$x$,0][$y$,90]
\end{pspicture*}

\end{document}

output