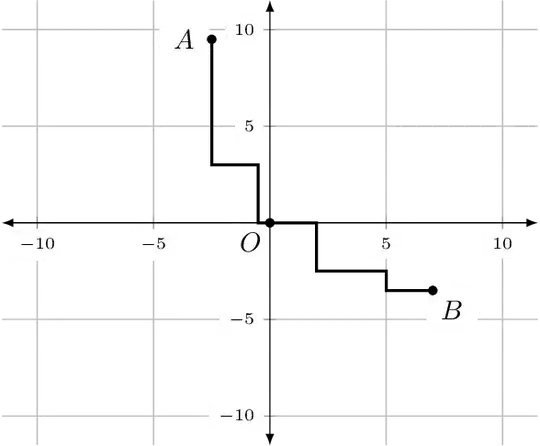
I am plotting lattice paths to two points. I would like to have help lines drawn on top of the Cartesian plane so that any line that is an integral distance from an axis is a solid line and any line that is an odd integral multiple of 0.5 from an axis is dashed. The help lines that I have are not even consistent with the axes!
How to I get the O, A, and B typeset over the help lines. The option [fill=white,circle,inner sep=0pt] is ignored in my code. So, one of the (misplaced) help lines is drawn over it.
\documentclass{amsart}
\usepackage{tikz}
\usetikzlibrary{calc,angles,positioning}


\usepackage{pgfplots}
\pgfplotsset{compat=1.11}

\begin{document}

\hspace*{\fill}
\begin{tikzpicture}
\begin{axis}[
    xmin=-11,xmax=11,ymin=-11,ymax=11,
    axis lines=middle,
    enlargelimits={abs=0.5},
    axis line style={latex-latex},
    ticklabel style={font=\tiny,fill=white},
    xlabel style={at={(ticklabel* cs:1)},anchor=north west},
    ylabel style={at={(ticklabel* cs:1)},anchor=south west}
        ]

\coordinate (O) at (0,0);
\node[fill=white,circle,inner sep=0pt] (O-label) at ($(O)+(-135:10pt)$) {$O$};
\coordinate (A) at (-2.5,9.5);
\node[fill=white,circle] (A-label) at ($(A)+(-180:10pt)$) {$A$};
\coordinate (B) at (7,-3.5);
\node[fill=white,circle] (B-label) at ($(B)+(-45:10pt)$) {$B$};

\draw[fill] (O) circle (1.5pt);
\draw[fill] (A) circle (1.5pt);
\draw[fill] (B) circle (1.5pt);

%These commands are for drawing a path from O to A.
\coordinate (A1) at (-0.5,0);
\coordinate (A2) at (-.5,3);
\coordinate (A3) at (-2.5,3);

\draw[line width=1pt] (O) -- (A1) -- (A2) -- (A3) -- (A);

%These commands are for drawing a path from O to B.
\coordinate (B1) at (2,0);
\coordinate (B2) at (2,-2.5);
\coordinate (B3) at (5,-2.5);
\coordinate (B4) at (5,-3.5);
\coordinate (B) at (7,-3.5);

\draw[line width=1pt] (O) -- (B1) -- (B2) -- (B3) -- (B4) -- (B);

\draw[help lines,line width=0.1pt,blue] (-10.5, -10.5) grid (10.5,10.5);


\end{axis}
\end{tikzpicture}
\hspace{\fill}
\vskip0.25in

\end{document}

(axis cs:x,y)or you need to upgrade to version 1.12 and explicitly putcompat=1.12. Then it will automatically assume axis coordinates. – percusse May 21 '15 at 17:33axis cs:to the points. How do I upgrade to version 1.12? I am looking at page 12 of the manual athttp://pgfplots.sourceforge.net/pgfplots.pdf. It says that "Windows users often use MikTEX which downloads the latest stable package versions automatically. You do not need to install anything manually here." I am using WinEdt 8.1. – user74973 May 21 '15 at 19:06Upgrad (admin)or something like that. If you select that it will search and show you the updatable packages . See this one http://tex.stackexchange.com/questions/55437/how-do-i-update-my-tex-distribution – percusse May 21 '15 at 19:08\pgfplotsset{compat=1.11}to\pgfplotsset{compat=1.12}in the preamble and tried to compile it. I got errors. – user74973 May 21 '15 at 20:41MikTeX2.7. A menu appeared. I selected "Update." Another menu appeared. I selected "I want to get updated packages from a remote package repository" and "Use the nearest package repository." I select "Next" and I get the error "The operation could not be completed because MikTeX is not supported anymore." What should I do to update to MikTeX2.9? – user74973 May 21 '15 at 21:20