5

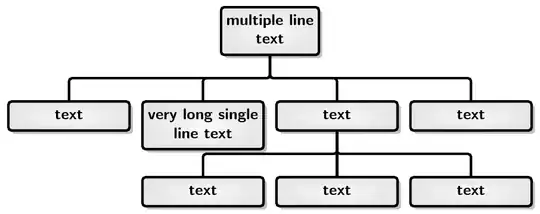
I am trying to convert my word document to latex document. I have an organization chart similar to the following picture: word organization chart

I tried the following code in latex but the result is not similar to word

\documentclass{standalone}
\usepackage{tikz}
\usetikzlibrary{trees}
\usepackage{tikz-qtree}

\begin{document}

\begin{tikzpicture}
\tikzset{ level distance=65pt, 
        edge from parent/.style=
            {thick, draw=black, edge from parent path={(\tikzparentnode.south) -- +(0,-10pt) -| (\tikzchildnode.north)}},
        every node/.style=
            {thick, draw=black, align=center, level distance=60pt, minimum height=40pt, text width=80pt}
    }
\Tree [.{multiple line\\text}
    [.text ]
    [.{very long single line text} ]
    [.text
        [.text ]
        [.text ]
        [.text ]
    ]
    [.text ]
]
\end{tikzpicture}
\end{document}

and the result is:

enter image description here

  • 1
    Have a look here: http://tex.stackexchange.com/questions/74518/using-boxes-with-two-rows-in-a-tikz-tree (Using boxes with two rows in a TikZ tree, answer from Gonzalo Medina). Any maybe add more code to your example so that the people here can compile it and see the result (a so called MWE). – Dr. Manuel Kuehner May 25 '15 at 11:48
  • @Manuel Kuehner, the problem is not about multiple line text, but the main problem is the 3rd level and many more problems... I edit my question and add my latex result to compare both of them together – ma.mehralian May 25 '15 at 12:49
  • For me there's a problem for the very long single line that tales two lines. What is it supposed to be, really? – Bernard May 25 '15 at 13:07

3 Answers3

8

I would enjoy the fact that you are not bound by the limitations of Word ;).

forest is a powerful tree-drawing package of which I am well-known to be fond:

\documentclass[tikz,border=5pt,multi]{standalone}
\usepackage{forest,array}
\usetikzlibrary{shadows}
\newcolumntype{C}[1]{>{\centering}p{#1}}
\begin{document}

  \begin{forest}
    for tree={
      if level=0{align=center}{% allow multi-line text and set alignment
        align={@{}C{25mm}@{}},
      },
      draw,
      font=\sffamily\bfseries,
      edge path={
        \noexpand\path [draw, \forestoption{edge}] (!u.parent anchor) -- +(0,-5mm) -| (.child anchor)\forestoption{edge label};
      },
      parent anchor=south,
      child anchor=north,
      l sep=10mm,
      tier/.wrap pgfmath arg={tier #1}{level()},
      edge={ultra thick, rounded corners=2pt},
      ultra thick,
      inner color=gray!5,
      outer color=gray!20,
      rounded corners=2pt,
      drop shadow,
    }
    [multiple line\\text
      [text]
      [very long single line text]
      [text
        [text]
        [text]
        [text]
      ]
      [text]
    ]
  \end{forest}

\end{document}

forest

alien
  • 96
4

If the trees format doesn't quite work, and since matrix can't handle the top node, you can always arrange the nodes individually.

tree

\documentclass[border=10pt]{standalone}
\usepackage{tikz}
\usetikzlibrary{calc}

\begin{document}

\begin{tikzpicture}
\tikzset{every node/.style=
            {thick, draw=black, align=center, minimum height=40pt, text width=80pt}
    }
\node(a1) {text};% start with left second level
\node[right=10pt] (a2) at (a1.east) {very long single line text};
\node[right=10pt] (a3) at (a2.east) {text};
\node[right=10pt] (a4) at (a3.east) {text};
\node[above=10pt] (top) at ($(a2.north)!.5!(a3.north)$) {multiple line\\text};
\node[below=10pt] (b2) at (a2.south) {text};
\node[below=10pt] (b3) at (a3.south) {text};
\node[below=10pt] (b4) at (a4.south) {text};
\coordinate (atop) at ($(top.south) + (0,-5pt)$);% midpoint below top
\coordinate (btop) at ($(a3.south) + (0,-5pt)$);% midoint below a3
\draw[thick] (top.south) -- (atop)
 (a1.north) |- (atop) -| (a4.north)
 (a2.north) |- (atop) -| (a3.north)
 (a3.south) -- (b3.north)
 (b2.north) |- (btop) -| (b4.north);
\end{tikzpicture}
\end{document}
John Kormylo
  • 79,712
  • 3
  • 50
  • 120
0

The dot program in the graphviz program family is very handy for drawing graphs of this sort, although the formatting may not match MSWord exactly. A file named sample.dot containing...

digraph G
{
    node [shape=box];
    edge [arrowhead=none];

    1  [label="multiple line\ntext"];
    2  [label="text"];
    3  [label="very long single\nline text"];
    4  [label="text"];
    5  [label="text"];
    6  [label="text"];
    7  [label="text"];
    8  [label="text"];

    1 -> 2;
    1 -> 3;
    1 -> 4;
    1 -> 5;
    4 -> 6;
    4 -> 7;
    4 -> 8;
}

Processed with dot -Tpdf sample.dot -o sample.pdf will produce this graph. Of course the pdf file will look much better than the image shown here.

enter image description here

James
  • 4,587
  • 1
  • 12
  • 27