3

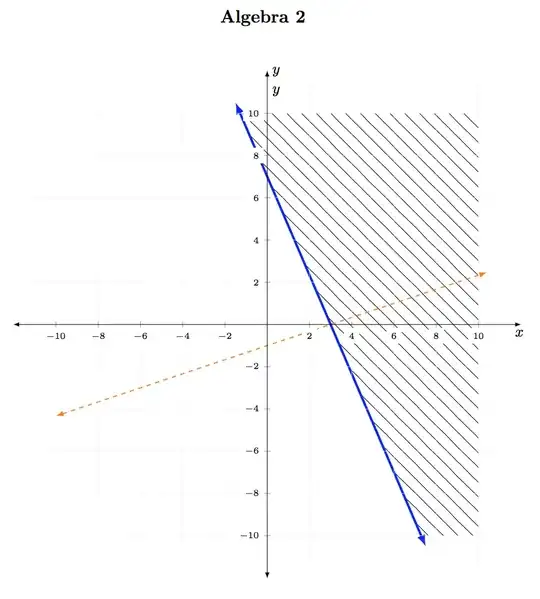
I am trying to show graphically the solution to the system of linear inequalities

\begin{equation*}

\begin{cases}
7x + 3y \geq 21 \\
-x + 3y < -3
\end{cases}
.
\end{equation*}

There are some modifications that I want to the display. First, I use pattern=north east lines for the solution set to 7x + 3y \geq 21. The lines are too close. I do not want the boundary. Second, I get an error when I tried to compile the code with pattern=south east lines. Third, I do not want these lines indicating the solution sets to interfere with the tick marks.

\documentclass{amsart}

\usepackage{tikz}
\usetikzlibrary{calc,angles,positioning,intersections,quotes,decorations.markings,backgrounds,patterns}

\usepackage{pgfplots}
\pgfplotsset{compat=1.11}


\begin{document}

\begin{center}\Large{\bf Algebra 2}\end{center}\vskip0.3in

\noindent \hspace*{\fill}
\begin{tikzpicture}
\begin{axis}[width=6in,grid=both,grid style={line width=.1pt, draw=gray!10},
    axis equal image,
    axis lines=middle,
    xmin=-11,xmax=11,
    ymin=-11,ymax=11,
    restrict y to domain=-11:11,
    xtick={},ytick={},
    ticklabel style={font=\tiny,fill=white},
    enlargelimits={abs=0.25cm},
    axis line style={latex-latex},
    axis line style={shorten >=-7.5pt, shorten <=-7.5pt},
    xlabel=$x$,
    ylabel=$y$,
    xlabel style={at={(ticklabel* cs:1)},anchor=north west},
    ylabel style={at={(ticklabel* cs:1)},anchor=south west}
]


\coordinate (P) at (-9/7,10);
\coordinate (Q) at (10,10);
\coordinate (R) at (10,-10);
\coordinate (S) at (51/7,-10);

\draw[pattern=north east lines] (P) -- (Q) -- (R) -- (S);


\coordinate (P1) at (-10,-13/3);
\coordinate (Q1) at (10,7/3);
\coordinate (R1) at (10,-10);
\coordinate (S1) at (-10,-10);

%\draw[pattern=south east lines] (P1) -- (Q1) -- (R1) -- (S1);

\addplot[latex-latex,samples=2,domain=-1.5:7.5,blue] {(-7/3)*x + 7};
\addplot[latex-latex,samples=2,domain=-10:10,dashed,green] {(1/3)*x -1};

\node[anchor=north west] at (axis description cs:1,0.5) {$x$};
\node[anchor=north west] at (axis description cs:0.5,1) {$y$};

\end{axis}
\end{tikzpicture}

\end{document}
user74973
  • 4,071

1 Answers1

2

Don't really like this, but I think this is what you asked for:

enter image description here

Notes:

  • Patterns are not easily changeable. I have used the code form Can I control the 'density' of a pattern in TikZ? to allow one to change the spacing between the lines. The density of the lines below can be changed via line space=<dimen>.

  • The border along the pattern was disabled via draw=none option.

  • Adding axis on top option allows the axis and tick labels to be on top.

  • There is no south east lines pattern, but there is a north west lines . I have applied the my north west lines as it was desired to alter the spacing between the lines.

Code:

\documentclass{amsart}

\usepackage{tikz} \usetikzlibrary{calc,angles,positioning,intersections,quotes,decorations.markings,backgrounds,patterns}

\usepackage{pgfplots} \pgfplotsset{compat=1.11}

%% https://tex.stackexchange.com/questions/29808/can-i-control-the-density-of-a-pattern-in-tikz \pgfdeclarepatternformonly[\LineSpace]{my north east lines}{\pgfqpoint{-1pt}{-1pt}}{\pgfqpoint{\LineSpace}{\LineSpace}}{\pgfqpoint{\LineSpace}{\LineSpace}}% { \pgfsetlinewidth{0.4pt} \pgfpathmoveto{\pgfqpoint{0pt}{0pt}} \pgfpathlineto{\pgfqpoint{\LineSpace + 0.1pt}{\LineSpace + 0.1pt}} \pgfusepath{stroke} }

\pgfdeclarepatternformonly[\LineSpace]{my north west lines}{\pgfqpoint{-1pt}{-1pt}}{\pgfqpoint{\LineSpace}{\LineSpace}}{\pgfqpoint{\LineSpace}{\LineSpace}}% { \pgfsetlinewidth{0.4pt} \pgfpathmoveto{\pgfqpoint{0pt}{\LineSpace}} \pgfpathlineto{\pgfqpoint{\LineSpace + 0.1pt}{-0.1pt}} \pgfusepath{stroke} }

\newdimen\LineSpace \tikzset{ line space/.code={\LineSpace=#1}, line space=3pt } \begin{document}

\begin{center}\Large{\bf Algebra 2}\end{center}\vskip0.3in

\noindent \hspace{\fill} \begin{tikzpicture} \begin{axis}[width=6in,grid=both,grid style={line width=.1pt, draw=gray!10}, axis equal image, axis lines=middle, xmin=-11,xmax=11, ymin=-11,ymax=11, restrict y to domain=-11:11, xtick={},ytick={}, ticklabel style={font=\tiny,fill=white}, enlargelimits={abs=0.25cm}, axis line style={latex-latex}, axis line style={shorten >=-7.5pt, shorten <=-7.5pt}, xlabel=$x$, ylabel=$y$, xlabel style={at={(ticklabel cs:1)},anchor=north west}, ylabel style={at={(ticklabel* cs:1)},anchor=south west}, axis on top, ]

\coordinate (P) at (-9/7,10); \coordinate (Q) at (10,10); \coordinate (R) at (10,-10); \coordinate (S) at (51/7,-10);

%% Adjust density of the lines by changing the line space= value. \draw[pattern=my north west lines, draw=none, line space=10pt] (P) -- (Q) -- (R) -- (S);

\coordinate (P1) at (-10,-13/3); \coordinate (Q1) at (10,7/3); \coordinate (R1) at (10,-10); \coordinate (S1) at (-10,-10);

%\draw[pattern=south east lines] (P1) -- (Q1) -- (R1) -- (S1);

\addplot[latex-latex,samples=2,domain=-1.5:7.5,blue, ultra thick] {(-7/3)x + 7}; \addplot[latex-latex,samples=2,domain=-10:10.4,dashed,orange, thick] {(1/3)x -1};

\node[anchor=north west] at (axis description cs:1,0.5) {$x$}; \node[anchor=north west] at (axis description cs:0.5,1) {$y$};

\end{axis} \end{tikzpicture}

\end{document}

Peter Grill
  • 223,288
  • I see that you removed the boundary to the north east lines. That is nice. The lines are too densely packed. Is there a better way to shade than using patterns or using north east and north west options in patterns? – user74973 Jun 10 '15 at 13:03
  • I like that the arrowheads on the blue line are outside the shading. I defined the domain of the blue line so that the highest point on it would be (-1.5, 10), but the arrowhead is distinctly above 10. How did this happen? I like the way it looks, though. I would like to get the orange line to extend past the (invisible) line x=10 just as much. – user74973 Jun 10 '15 at 13:10
  • @user74973: Have adjust the density of the lines. Play around with with line space= parameter to get the desired results. Also extended the domain of the orange line to get the arrow past the pattern. – Peter Grill Jun 10 '15 at 17:49
  • Thanks for adding the comment about removing the border along the pattern via draw=none. – user74973 Jun 10 '15 at 19:08
  • By the way, I added circle,inner sep=1.5pt to the options for ticklabel style=. The display looks much better with less white space in the mesh of hatching. – user74973 Jun 10 '15 at 22:25
  • This is really picky ... but noticeable. Your display seems to have the north east and north west lines below the grid. When I compile your code, the north east and north west lines are drawn above the grid, which is distracting. How do I get these hatching lines above the grid? – user74973 Jun 10 '15 at 22:25
  • 1
    @user74973: I suspect one of your packages are out of date. I am using the latest versions of the pacakges of the TeXLive2014. – Peter Grill Jun 10 '15 at 22:29