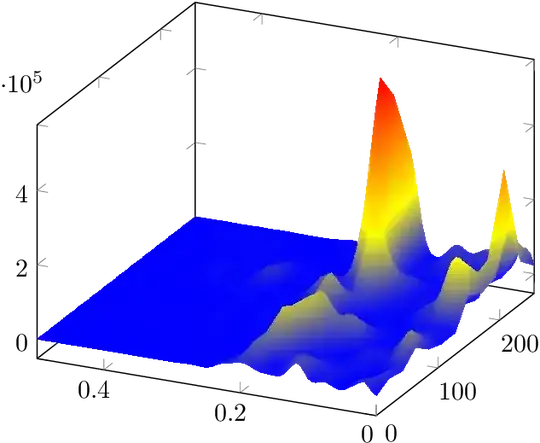
I have a .csv file with 3 columns: time, f and psd. I would like to create a 3D surf plot using this data. Just like the following image generated in Matlab.  .
.
Here is the link to the data I am trying to use: datastft.csv.
The code that I am using is the following:
\documentclass{standalone}
\usepackage{pgfplots}
\usepackage{filecontents}
\pgfplotsset{compat=1.9}

\begin{document}
\begin{tikzpicture}
\begin{axis}
\addplot3 [surf] table[x=time, y=f, z=psd, col sep=comma] {datastft.csv};

\end{axis}
\end{tikzpicture}
\end{document}
Using this code I am getting this image with lines:

Any help would be greatly appreciated.


septocol sep, and adding the missing semicolon at the end of the\addplotline. – Torbjørn T. Jun 17 '15 at 13:30datastft.csvdirectly to your question and do not link them to a cloud solution. – Bobyandbob Jul 11 '17 at 17:21