I want to use TikZ to describe/display the user interface of tool. Therefore, I need a text block that is conected to a rectangle with a line (see example below) but I don't know how to connect the text block with the rectangle. Could you please help me or provide a quick example?
Asked
Active
Viewed 660 times
3 Answers
1
Using the answers of Caramdir and Jake to this question, you can do this:
\documentclass{article}
\usepackage{tikz}
\begin{document}
\begin{tikzpicture}
\node[anchor=south west,inner sep=0] (image) at (0,0)
{\includegraphics[width=0.5\textwidth]{mushroom}};
\begin{scope}[x={(image.south east)},y={(image.north west)}]
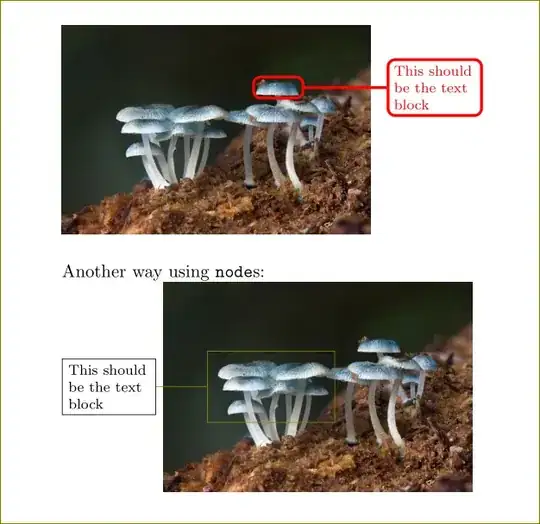
\draw[red,ultra thick,rounded corners] (0.62,0.65) rectangle (0.78,0.75);
\draw[red,ultra thick] (0.78,0.7) -- (1.05,0.7)
node[draw,red,ultra thick,rounded corners,font=\footnotesize,,text
width=1.6cm,anchor=west]{This should be the text block};
\end{scope}
\end{tikzpicture}
\bigskip
Another way using \verb|node|s:
\begin{tikzpicture}
\node[anchor=south west,inner sep=0] (image) at (0,0)
{\includegraphics[width=0.5\textwidth]{mushroom}};
\begin{scope}[x={(image.south east)},y={(image.north west)}]
\node[draw,olive,minimum width=2.5cm,minimum height=1.4cm] (a) at (0.35,0.5) {};
\draw[olive] (a.west) -- +(-1cm,0cm)
node[draw,black,font=\footnotesize,,text
width=1.6cm,anchor=east]{This should be the text block};
\end{scope}
\end{tikzpicture}
\end{document}
1
Thanks for the example.
Here is my code that I did until yesterday:
\documentclass[a4paper, 11pt, oneside]{scrbook}
\usepackage{tikz,xcolor}
\definecolor{tadruby}{HTML}{8B0000}
\usepackage[left=2cm, right=1.5cm, top=1.5cm, bottom=1cm]{geometry}
\begin{document}
\begin{figure}[htb]
\centering
\begin{tikzpicture}
\node[anchor=south west, inner sep=0] (image) at (0,0) {\includegraphics[width=13cm]{Figures/mushroom.jpg}};
\draw[tadruby, very thick, rounded corners] (0, 8.05) rectangle (13, 7);
\node[draw=tadruby,text width=3cm] at (-2,7.5) {Test text};
\end{tikzpicture}
\end{figure}
\end{document}
But now I "played" a little with your code and would like to know why the units inside the scope starts from 0 to 1 (from one figure corner to the next) and not uses the cm unit?
Torbjørn T.
- 206,688
Lars H.
- 61
-
1Please edit your previuos question, don't answer with another question, thank you! – CarLaTeX Sep 07 '16 at 05:20
-
-
-
@ChristianHupfer I beg your pardon, I didn't think about reputation points! – CarLaTeX Sep 07 '16 at 06:02
-
@ChristianHupfer: Beginners can comment on their own questions and the answers to them even with 1rep. – Martin Scharrer Sep 09 '16 at 08:12
-
1
Harish Kumar's answer is an excellent and elegant solution to the problem of adding annotations to a graphic. Because the principle is that the coordinates of the annotations are some fraction of the width and height of the graphic, I find it useful to add a simple grid to determine the coordinates:
\documentclass[tikz,border=3mm]{standalone}
\newcommand{\mygrid}{%
\draw[white,thin,xstep=0.05,ystep=0.05] (0,0) grid (1,1);
\draw[white,thick,xstep=0.1,ystep=0.1] (0,0) grid (1,1);
}
\begin{document}
\begin{tikzpicture}
\node[anchor=south west,inner sep=0] (image) at (0,0)
{\includegraphics[width=0.5\textwidth]{mushroom}};
\begin{scope}[x={(image.south east)},y={(image.north west)}]
\mygrid
\node[draw,red,minimum width=2.5cm,minimum height=1.4cm] (a) at (0.35,0.5) {};
\draw[olive] (a.west) -- +(-1cm,0cm)
node[draw,black,font=\footnotesize,,text
width=1.6cm,anchor=east]{This should be the text block};
\end{scope}
\end{tikzpicture}
\end{document}
Just delete or comment-out \mygrid when you're done.
sgmoye
- 8,586


