I have some old drawings prepared in Word which I would like to translate into TikZ. Being a complete novice and having never worked with TikZ before, I am really struggling with getting started.
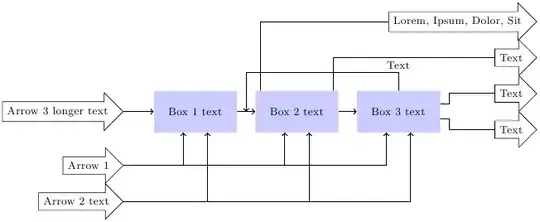
Here is the first flow chart that I want to convert:

One solution that appealed to me due to its simplicity was using a matrix and chains as explained in a tutorial in the manual. But then I already run into trouble with the two arrows that have to point to boxes 1, 2, and 3.
So my question boils down to: What is the easiest way to convert this chart into TikZ?
Don't worry I'm not asking for code. I just want to know how to start, because finding your way in something as complex as TikZ, with an 800 page manual!, can be very frustrating for a beginner.
Update Oct 17, 2011
Getting the hang of it! Here is the output I can currently produce. Last question:
Any ideas how to align the arrows by their tips?
\documentclass[ngerman]{scrartcl}

\usepackage{ucs}
\usepackage[utf8x]{inputenc}
\usepackage{tikz}
\usetikzlibrary{shapes,arrows,positioning,calc}

\begin{document}

\tikzstyle{block} = [rectangle, fill=blue!20, minimum height=3em, minimum width=6em] \tikzstyle{arrow} = [single arrow, draw]

\begin{tikzpicture}[auto, node distance=0.5cm and 0.5cm, arr/.style={->,thick}, line/.style={thick}, font=\footnotesize]

\node (stoffVor) [block] {Box 1 text};
\node (haupt) [block, right=of stoffVor, align=center] {Box 2 text};
\node (stoffNach) [block, right=of haupt] {Box 3 text};
\node (pfeil1) [arrow, below left=of stoffVor] {Arrow 1};
\node (pfeil2) [arrow, below=of pfeil1] {Arrow 2 text};
\node (pfeil0) [arrow, left=of stoffVor] {Arrow 3 longer text};
\node (neben) [arrow, below right=of stoffNach, label=below:, yshift=0.5cm, xshift=1cm] {Text};
\node (hauptP) [arrow, above right=of stoffNach, label=above:,yshift=-0.5cm,xshift=1cm] {Text};
\node (pfeil3) [arrow, above=of hauptP] {Text};
\node (pfeil4) [arrow, above=of pfeil3] {Lorem, Ipsum, Dolor, Sit};

\draw[arr] (pfeil0.east) -- (stoffVor.west);
\draw[arr] (stoffVor.east) -- (haupt.west);
\draw[arr] (haupt.east) -- (stoffNach.west);
\draw[arr] (stoffNach.north) --  ++(0,0.5) node [auto, swap, yshift=6] {Text} -| ($ (stoffVor.east) + (0.25,0) $);
\draw[arr] (pfeil1.east) -| (stoffVor.240);
\draw[arr] (pfeil1.east) -| (haupt.240);
\draw[arr] (pfeil1.east) -| (stoffNach.240);
\draw[arr] (pfeil2.east) -| (stoffVor.300);
\draw[arr] (pfeil2.east) -| (haupt.300);
\draw[arr] (pfeil2.east) -| (stoffNach.300);
\draw[line] (haupt.150) |-  (pfeil4.west);
\draw[line] (haupt.30) |-  (pfeil3.west);
\draw[line] (stoffNach.350) -- ++ (0.25,0) -- ++ (0,-0.1) |- (neben.west);
\draw[line] (stoffNach.10) -- ++ (0.25,0) -- ++ (0, +0.1) |- (hauptP.west);

\end{tikzpicture}

\end{document}


(box1.260)means a point in the border ofbox1node at an angle of 260 degrees. Another option is([xshift=-5mm]box1.south). I'm sorry but I have no tikz at hand to test and provide a better answer. – Ignasi Oct 08 '11 at 13:17