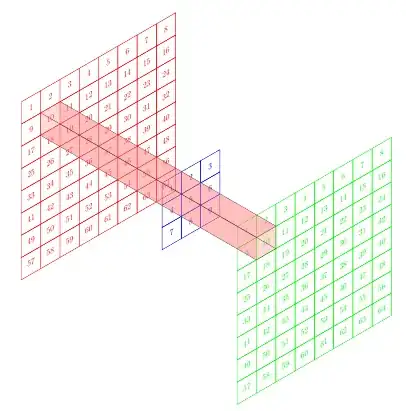
Here is a beginning of solution, I filled the table with any values.
you must use the commands canvas to draw on inclined plane and use transform shape for as bow node
\documentclass{scrartcl}
 \usepackage{tikz}
 \usetikzlibrary{arrows,3d,matrix}

 % see the explanation below
 \makeatletter
 \tikzoption{canvas is xy plane at z}[]{%
   \def\tikz@plane@origin{\pgfpointxyz{0}{0}{#1}}%
   \def\tikz@plane@x{\pgfpointxyz{1}{0}{#1}}%
   \def\tikz@plane@y{\pgfpointxyz{0}{1}{#1}}%
   \tikz@canvas@is@plane
 }
 \makeatother

\begin{document}
\begin{tikzpicture}
 [x={(0.866cm,0.5cm)}, y={(-0.866cm,0.5cm)}, z={(0cm,1cm)}, scale=0.8]


    \begin{scope}[canvas is xz plane at y=0,transform shape]
      %\draw[blue] (0,0) -- (10,0)--(10,10)--(0,10)--cycle;
      \foreach \ii [count = \xi] in {1,2,3,...,8}{
            \foreach \jj  [count = \yi]in {1,2,3,...,8}{
            \pgfmathsetmacro{\nn}{int(\xi+8*\yi-8)}
      \node[red,draw,minimum size=1cm] (n\nn-1) at (\ii,-\jj) {\nn};
      }
      }

      \end{scope}

        \begin{scope}[canvas is xz plane at y=-7.3,transform shape]
      \foreach \ii [count = \xi] in {1,2,3}{
            \foreach \jj  [count = \yi]in {1,2,3}{
            \pgfmathsetmacro{\nn}{int(\xi+3*\yi-3)}
      \node[blue,draw,minimum size=1cm] (n\nn-2) at (\ii,-\jj) {\nn};
      }
      }
      \end{scope}

      \begin{scope}[canvas is xz plane at y=-11.2,transform shape]
      \foreach \ii [count = \xi] in {1,2,3,...,8}{
            \foreach \jj  [count = \yi]in {1,2,3,...,8}{
            \pgfmathsetmacro{\nn}{int(\xi+8*\yi-8)}
      \node[green,draw,minimum size=1cm] (n\nn-3) at (\ii,-\jj) {\nn};
      }
      }
      \end{scope}

      \draw[fill=red!50,opacity=0.3] (n10-1.north east) -- (n5-2.north east) --(n10-3.north east)
      --(n10-3.north west)-- (n5-2.north west) --  (n10-1.north west)  ;
      \draw[fill=red!50,opacity=0.3] (n10-1.south east) -- (n5-2.south east) --(n10-3.south east)
      --(n10-3.south west)-- (n5-2.south west)-- (n10-1.south west)  ;
      \draw[fill=red!50,opacity=0.3] (n10-1.north east) -- (n5-2.north east) --(n10-3.north east)
      --(n10-3.south east)-- (n5-2.south east)-- (n10-1.south east)  ;

      \draw[fill=red!50,opacity=0.3] (n10-3.north west)-- (n5-2.north west) --  (n10-1.north west) -- (n10-1.south west)-- (n5-2.south west)   --(n10-3.south west) ;

  \end{tikzpicture}

  \end{document}