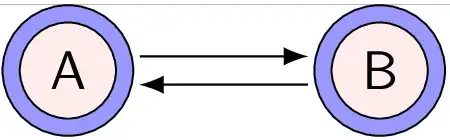
Implementation using a double line:
\documentclass{beamer}
\usepackage{tikz}
\usetikzlibrary{arrows.meta, automata, calc, positioning, quotes}

\begin{document}

\begin{tikzpicture}[
    shorten < =  1mm, shorten > = 1mm,
    node distance = 22mm, on grid, auto,
    every path/.style = {-Latex},
    state/.append style = {
      % draw=pink!30!black,
      double=blue!40!white,
      double distance=3pt,
      fill=pink!30,
      minimum size=8mm,
    },
    sx+/.style = {xshift=1 mm},
    sy+/.style = {yshift=1 mm},
    sx-/.style = {xshift=-1 mm},
    sy-/.style = {yshift=-1 mm},
]
\node[state] (A) {A};
\node[state] (B) [right=of A] {B};

\path[->]   ([sy+] A.east)  edge [] ([sy+] B.west)

            ([sy-] B.west)  edge []  ([sy-] A.east);
\end{tikzpicture}
\end{document}
With small (node font=\small) text with math in the circles:
\documentclass{beamer}
\usepackage{tikz}
\usetikzlibrary{arrows.meta, automata, calc, positioning, quotes}

\begin{document}

\begin{tikzpicture}[
    shorten < =  1mm, shorten > = 1mm,
    node distance = 22mm, on grid, auto,
    every path/.style = {-Latex},
    state/.append style = {
      % draw=pink!30!black,
      double=blue!40!white,
      double distance=3pt,
      fill=pink!30,
      minimum size=8mm,
      node font=\small,
    },
    sx+/.style = {xshift=1 mm},
    sy+/.style = {yshift=1 mm},
    sx-/.style = {xshift=-1 mm},
    sy-/.style = {yshift=-1 mm},
]
\node[state] (A) {Set $A$};
\node[state] (B) [right=of A] {Set $B$};

\path[->]   ([sy+] A.east)  edge [] ([sy+] B.west)

            ([sy-] B.west)  edge []  ([sy-] A.east);
\end{tikzpicture}
\end{document}

With writing into the blue parts
IMHO, this is quite ugly, the same is the code for the implementation of the feature.
\documentclass{beamer}
\usepackage{tikz}
\usetikzlibrary{arrows.meta, automata, calc, positioning, quotes}

\begin{document}

\begin{tikzpicture}[
    shorten < =  1mm, shorten > = 1mm,
    node distance = 22mm, on grid, auto,
    every path/.style = {-Latex},
    state/.append style = {
      % draw=pink!30!black,
      % double=blue!40!white,
      % double distance=3pt,
      % fill=pink!30,
      minimum size=8mm,
      node font=\small,
    },
    sx+/.style = {xshift=1 mm},
    sy+/.style = {yshift=1 mm},
    sx-/.style = {xshift=-1 mm},
    sy-/.style = {yshift=-1 mm},
]

\newcommand*{\StateNode}[3][]{%
  % Draw blue circle in the final size
  \node[state, fill=blue!40!white, #1] (#2) {\phantom{#3}};
  % Draw smaller pink circle
  \node[state, fill=pink!30, inner sep=-5pt] at (#2) {\phantom{#3}};
  % Put the text on top
  \node at (#2) {#3};
}
\StateNode{A}{Set $A$}
\StateNode[right=of A]{B}{Set $B$}

\path[->]   ([sy+] A.east)  edge [] ([sy+] B.west)

            ([sy-] B.west)  edge []  ([sy-] A.east);
\end{tikzpicture}
\end{document}


acceptingto the node options. – gernot Nov 12 '16 at 11:16