22

I'm working on a Smith Chart using TikZ. Currently I'm writing it with everything scaled to a unit circle (centered on 0,0 with a radius of 1) without units. Then scaling so it's a reasonably sized figure.

The problem I'm running into is that when drawing some of the minor grid lines for certain sections, particularly when you're close to the x-axis the radius of the circles i'm drawing becomes much larger than is possible in TikZ.

For example this halts with a Dimension too large error due to the 1/\x term for position and radius:

    \foreach \x in {0.01, 0.02, ..., 0.2} {
            \draw (1, {1/\x}) circle ({1/\x});
    }

Image without circles whose radii are too large:

Image without circles whose radii are too large.

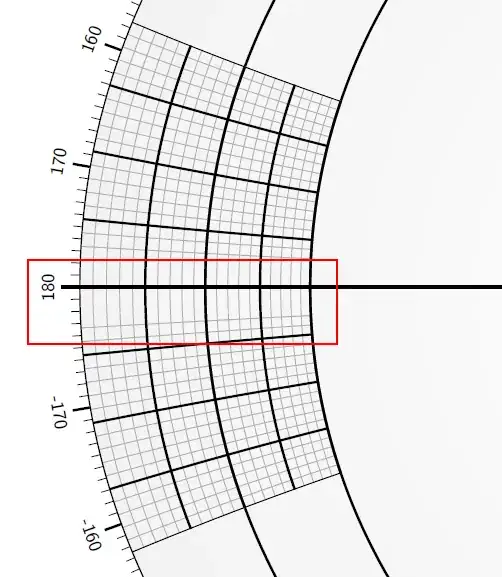
What I'm thinking, is instead of drawing individual circles it would be much easier to draw a polar grid to avoid drawing circles with extremely large radii. However, I haven't been able to find any information about how to do that.

Is there a package or work-around for drawing polar grids?

diabonas
  • 25,784
BeMasher
  • 223

2 Answers2

20

Version 1.5 of pgfplots includes a Smith chart library. This is an example from its manual

\documentclass{standalone}
\usepackage{pgfplots}
\usepgfplotslibrary{smithchart}
\begin{document}
\begin{tikzpicture}[scale=0.75]
\begin{smithchart}[
title=Huge  Smith  Chart  (rescaled),
width=20cm]
\addplot  coordinates  {(0.5,0.2)  (1,0.8)  (2,2)};
\end{smithchart}
\end{tikzpicture}
\end{document}

enter image description here

Ignasi
  • 136,588
19

You could use PGFplots (version 1.5) for this. It can draw polar axes with very flexible customisation possibilities:

\documentclass{article}
\usepackage{pgfplots}
\usepgfplotslibrary{polar}

\begin{document}
\begin{tikzpicture}
\begin{polaraxis}[
    width=40cm,
    xmin=160,xmax=200,
    ymin=2,ymax=3,
    yticklabels={},
    xtick={160,165,...,200},
    xticklabels={160,165,...,180,-175,-170,...,-160},
    minor tick num=4,   
    grid=both,
    minor grid style=black!25,
    major grid style={black!75,thick}]
\addplot coordinates {(0,1) (90,1)
(180,1) (270,1)};
\end{polaraxis}
\end{tikzpicture}

\end{document}
Jake
  • 232,450
  • @BeMasher: I've edited my answer. Is that what you're looking for? Maybe you could edit your question to include some more detail of what you want the final result to look like. – Jake Nov 18 '11 at 10:50
  • This is exactly what I was aiming for thanks for the help! – BeMasher Nov 19 '11 at 10:46
  • 2
    Wow, scrolling this answers image (and the questions image) up and down in the browser gives a really weird optical effect. It looks like they're moving! – morbusg Jan 25 '12 at 14:38