Here is a preliminary example (depending on what you are looking for) using a for loop,
\documentclass{article}
\usepackage{tikz}
\begin{document}
\begin{tikzpicture}
\def\repeatno{40}
\node[inner sep=0.5cm,circle] (base) at (0,0) {};
\foreach \x in {1,2,...,\repeatno}{
\draw[rotate=(\x*360/\repeatno)-90] (base.\x*360/\repeatno) to [in=-70,out=70]  ++(0,2) to [in=90,out=-30] ++(1.3,-2) to [in=20,out=160] +(-1.3,0);
}
\end{tikzpicture}
\end{document}
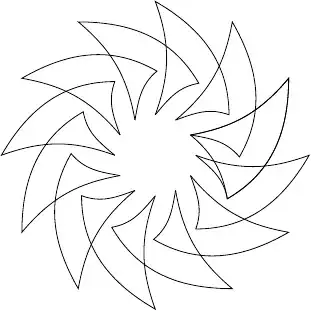
which gives

Take 2 After some modification I was able to get the curve except the closing artifact. But I am really getting high with this :) Might be banned in some countries. Here is what I did (and failed slightly)
\begin{tikzpicture}
\def\repeatno{12}
\node[inner sep=0.5cm,circle] (base) at (0,0) {};
\foreach[remember=\x as \lastx (initially 1)] \x in {1,2,...,13} {
\draw[rotate=(\x*360/\repeatno)-90] (base.\x*360/\repeatno) to [in=-70,out=70]  ++(0,2)%
 to [in=90,out=-30] ++(1.3,-2) to [in=20,out=160] (base.\lastx*360/\repeatno);
}
\end{tikzpicture}
with the result (reduced the number of repetitions to make the artifact visible)
Seems like, I need an additional step to close the curve properly after the foreach loop. Please feel free to correct or improve
Take 3 Fixed (without the automated version, possible though)
\begin{tikzpicture}
\def\repeatno{24}
\node[inner sep=0.5cm,circle] (base) at (0,0) {};
\foreach[remember=\x as \lastx (initially 1)] \x in {2,...,23} {
\draw[rotate=(\x*360/\repeatno)-90] (base.\x*360/\repeatno) to [in=-70,out=70]  ++(0,2)%
 to [in=90,out=-30] ++(1.3,-2) to [in=20,out=160] (base.\lastx*360/\repeatno);
}
\draw[rotate=360/\repeatno-90] (base.360/\repeatno) to [in=-70,out=70]  ++(0,2)%
 to [in=90,out=-30] ++(1.3,-2) to [in=20,out=160] (base.0);
\draw[rotate=-90] (base.0*360/\repeatno) to [in=-70,out=70]  ++(0,2) to [in=90,out=-30] ++(1.3,-2) to [in=20,out=160] (base.-1*360/\repeatno);
\end{tikzpicture}
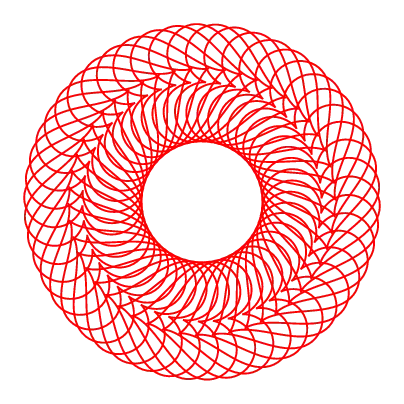
Here is the result

Please, let us know how exactly you want to parameterize the curve. I have used something with eye-balling but possibly you might have concrete examples in mind.


\draw plot[variable=\t,samples=100,domain=0:1] ({x(\t)},{y(\t)});where the canvas is also rotated as a function of\t. However, I don't know how to make a piecewise function, so I didn't know where to go from here. – Serge Nov 28 '11 at 14:23