I am trying to do a 2D surface plot, and the way to do this in pgfplots seems to be making a 3D surface plot, and then adjusting the view. And this works fine, until I try to adjust the aspect ratio. The 2D options don't work, because it is a 3D plot afterall, and the plot box ratio ceases to work once I adjust the view. I adopted an example from the pgfplots manual (section 4.5.2, all y values multiplied by two):
\documentclass{article}
\usepackage{pgfplots}
\begin{document}
\begin{tikzpicture}
\begin{axis}[view={0}{90},plot box ratio={1}{2}{1}]
% We have `surfdata.dat' with
% ---------
% 0 0 0.8
% 1 0 0.56
% 2 0 0.5
% 3 0 0.75
%
% 0 2 0.6
% 1 2 0.3
% 2 2 0.21
% 3 2 0.3
%
% 0 4 0.68
% 1 4 0.22
% 2 4 0.25
% 3 4 0.4
%
% 0 6 0.7
% 1 6 0.5
% 2 6 0.58
% 3 6 0.9
% -> yields a 4x4 matrix:
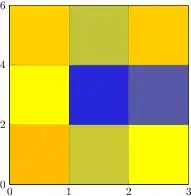
\addplot3[surf] file {surfdata.dat};
\end{axis}
\end{tikzpicture}
\end{document}
My output is on the left, my expected output on the right (obviously I don't want all the ticks distorted).


y post scale. Perhaps that is better to use in the sense that it is from PGFplots, but it changes the ticks on theyaxis. – Torbjørn T. Dec 22 '11 at 12:34unit vector ratio*=2 1turns out to be the same asx=(2,0), y=(0,1), and this overrides the automatic downscaling that makes sure the resulting plot won't be miles wide/tall. – derabbink Jan 11 '14 at 09:45