It is certainly possible using the methods of this answer, i.e. by remembering the nodes and placing an overlay.
\documentclass{article}
\usepackage{tikz-cd}
\usepackage{amsmath}
\DeclareMathOperator*{\im}{Im}
\begin{document}
\[
\begin{tikzcd}[remember picture] % see https://tex.stackexchange.com/a/256562/121799
 & & & 0 &  \\
0\arrow[r] & \ker{d^i}\arrow[d]\arrow[r] &
 A^i\arrow[d]\arrow[r] & \im a{d^{i-1}}\arrow[r]\arrow[u] & 0\\
0 \arrow[r] &  H^i(A^*)\arrow[r] & A^i/ \im a{d^{i-1}}\arrow[ur] & &
\end{tikzcd}
\]
\tikz[remember picture,overlay]{
\draw[-] (tikz@f@1-3-1.south west|-tikz@f@1-3-3.south east)
--(tikz@f@1-3-1.north west|-tikz@f@1-3-3.north)
--(tikz@f@1-3-3.north) --(tikz@f@1-2-4.west)
--(tikz@f@1-2-4.west|-tikz@f@1-1-4.north west)
--(tikz@f@1-2-4.south east|-tikz@f@1-1-4.north east)
--(tikz@f@1-2-4.south east)
--(tikz@f@1-3-3.south east)--cycle;
}
\end{document}
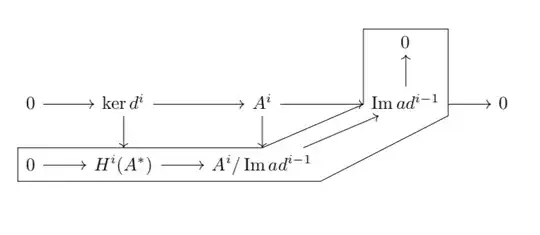
As you see, the contour tends to interfere with the arrows. One can cure this by adding some small shifts here and there. But I'd like to argue that an even better way of highlighting the contour is to shade it.
\documentclass{article}
\usepackage{tikz-cd}
\usepackage{amsmath}
\DeclareMathOperator{\Ima}{Im}
\begin{document}
\[
\begin{tikzcd}[remember picture] % see https://tex.stackexchange.com/a/256562/121799
 & & & 0 &  \\
0\arrow[r] & \ker{d^i}\arrow[d]\arrow[r] &
 A^i\arrow[d]\arrow[r] & \Ima a{d^{i-1}}\arrow[r]\arrow[u] & 0\\
0 \arrow[r] &  H^i(A^*)\arrow[r] & A^i/ \Ima a{d^{i-1}}\arrow[ur] & &
\end{tikzcd}
\]
\tikz[remember picture,overlay]{
\fill[blue,opacity=0.2] (\tikzcdmatrixname-3-1.south west|-\tikzcdmatrixname-3-3.south east)
--(\tikzcdmatrixname-3-1.north west|-\tikzcdmatrixname-3-3.north)
--(\tikzcdmatrixname-3-3.north) --(\tikzcdmatrixname-2-4.west)
--(\tikzcdmatrixname-2-4.west|-\tikzcdmatrixname-1-4.north west)
--(\tikzcdmatrixname-2-4.south east|-\tikzcdmatrixname-1-4.north east)
--(\tikzcdmatrixname-2-4.south east)
--(\tikzcdmatrixname-3-3.south east)--cycle;
}

\[
\begin{tikzcd}[remember picture] % see https://tex.stackexchange.com/a/256562/121799
 & & & 0 &  \\
0\arrow[r] & \ker{d^i}\arrow[d]\arrow[r] &
 A^i\arrow[d]\arrow[r] & \Ima a{d^{i-1}}\arrow[r]\arrow[u] & 0\\
0 \arrow[r] &  H^i(A^*)\arrow[r] & A^i/ \Ima a{d^{i-1}}\arrow[ur] & &
\end{tikzcd}
\]
\tikz[remember picture,overlay]{
\fill[red,opacity=0.2] (\tikzcdmatrixname-3-1.south west|-\tikzcdmatrixname-3-3.south east)
--(\tikzcdmatrixname-3-1.north west|-\tikzcdmatrixname-3-3.north)
--(\tikzcdmatrixname-3-3.north) --(\tikzcdmatrixname-2-4.west)
--(\tikzcdmatrixname-2-4.west|-\tikzcdmatrixname-1-4.north west)
--(\tikzcdmatrixname-2-4.south east|-\tikzcdmatrixname-1-4.north east)
--(\tikzcdmatrixname-2-4.south east)
--(\tikzcdmatrixname-3-3.south east)--cycle;
}
\end{document}

In this case, you do not have to mess around with these shifts.
NOTE: In the first snippet, the first number, 1, in tikz@f@1-3-3 (say) refers to the diagram. If you have more than one commutative diagrams (as in the second snippet), one needs to to take care that. I didn't find a documentation on that, but in tikzlibrarycd.code.tex one finds
\def\tikzcd@ar@target{\tikzcdmatrixname-\tikzcd@currentrow-\tikzcd@currentcolumn}
And this seems to do the trick.


I find this weird because my diagram has 3 rows. When I change the number 3 to 2 it doesn't produce any error but it draws something different in a different place (not even close to where my diagram is but in a corner of the page)
– Javi Apr 19 '18 at 12:05\imdoes not cause these issues unless you overwrite an existing command.) – Apr 19 '18 at 15:09\tikz[remember picture,overlay]{...}? – Apr 19 '18 at 15:31