I have the opposite problem to this question. I want the decimal parts of an integer printed for consistency's sake. I already tried specifying the precision but without success. See below. 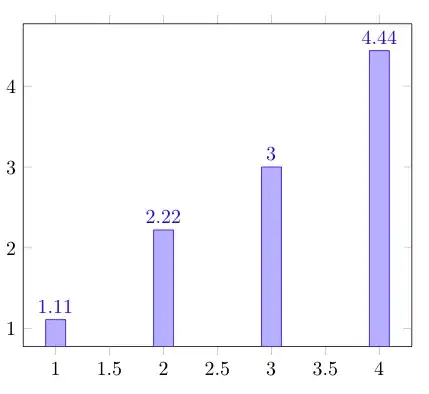
\documentclass{article}
\usepackage{pgfplots}

\begin{document}
\begin{tikzpicture}
\begin{axis}[ybar,
nodes near coords, %={\pgfmathprintnumber[fixed,precision=2]{\pgfplotspointmeta}}
]
\addplot coordinates { (1,1.11) (2,2.22)(3,3.00)(4,4.44) };
\end{axis}
\end{tikzpicture}
\end{document}
Follow up question in response to Peter Grill's answer:
Is it possible to let this specifications only affect the nodes over the bars and let the axis ticks stay without additional decimal parts? That would be the high point.
Answer: By chance I already found the answer to that one myself. Setting
\pgfkeys{
    /pgf/number format/precision=0,
    /pgf/number format/fixed zerofill=true }
to 0 and using
nodes near coords={\pgfmathprintnumber[fixed,precision=2]{\pgfplotspointmeta}}
in the axis-specifications, I get "normal " integers on the axes and enforced decimal parts in the chart itself.

pgfmath, but your example is usingpgfplots, which is not the same. Please change the title accordantly if this question is directly targeted onpgfplots, notpgfmathmacros in general. – Martin Scharrer Feb 02 '12 at 16:28pgfplotsandpgfmathis basic at best. I encountered this problem by usingpgfplotsand deducted from posts such as the linked one that there must be something aspgfmathat work here. So if someone knows what the better title would be, please tell me and I'll change it accordingly. – meep.meep Feb 03 '12 at 09:23