An answer in three parts.
Part 1: a partial non-TikZ solution
Here's the start of a solution that does not resort to TikZ. There's definitely room for improvement. But this is surely better than what I posted earlier for a non-TikZ approach.
\documentclass{article}
\usepackage[draft]{graphicx}
\usepackage{amsmath}
\usepackage[margin=0.1in]{geometry}
\graphicspath{{../images/}}

\newcommand{\myxdownarrow}[2]{%%
  %% use raisebox here to shift the vertical arrow down
  %% so that it appears to only span the portion of the
  %% table contains the images
  \raisebox{-3ex}[0.5\dimexpr#1]{$\pmb{\left\downarrow\rule[-0.5\dimexpr#1-3ex]{0pt}{\dimexpr#1-3ex}\right.}$}}%%
\newcommand{\myxrightarrow}[1]{%%
  %% use raisebox here to shift the horizontal arrow down
  %% so that it appears below the labels across the top of
  %% the table
  \raisebox{-4ex}[0pt][0pt]{\rotatebox{90}{$\pmb{\left\downarrow\rule[-0.5\dimexpr#1]{0pt}{#1}\right.}$}}}%%

\newsavebox\aepic
\newlength\aelength

\newsavebox\aepicA
\newsavebox\aepicB
\newsavebox\aepicC
\newsavebox\aepicD

\makeatletter

\newtoks\ae@tok@master

%% ------------------------------------------------------------
%% two arguments:
%% ARG #1=label for the row being created
%% ARG #2=contents of the row
%%        foreach each cell three pieces need to be passed
%%
%%        * optional arguments for \includegraphics
%%        * file handle for image to be used
%%        * the name of a save box for this particular image
%%
%%        which will be used by an internal command \ae@process@item
%% ------------------------------------------------------------
\newcommand\aejustrow[2]{%%
  \ae@tok@master={}%%
  \def\ae@wd{0pt}%%
  \def\ae@ht{0pt}%%
  \def\ae@row@label{#1}%%
  \ae@row@content#2;\relax;\relax\end@row@content
  \expandafter\typeout\expandafter{\the\ae@tok@master}%%
  \rotatebox{90}{\makebox[\ae@ht][c]{#1}} \the\ae@tok@master
}

%%
\def\ae@row@content#1;#2\end@row@content{%%
  \ifx\relax#1
    \def\ae@continue{}%%
  \else
    \ae@process@item#1;%%
    \def\ae@continue{\ae@row@content#2\end@row@content}%%
  \fi
  \ae@continue
  }

%% ARG #1 = options to be passed to \includegraphics
%% ARG #2 = image file handle
%% ARG #3 = savebox name
\def\ae@process@item#1#2#3;{%%
  %% see https://tex.stackexchange.com/a/49136/22413
  %% for what's going on with `0\null\global....`
  \begin{lrbox}{0\null\global\setbox#3}%%
    \includegraphics#1{#2}%%
  \end{lrbox}%%
  %% determine the maximal height of the images being used.
  \ifdim\ae@ht<\ht#3%%
    \xdef\ae@ht{\the\ht#3}%%
  \fi
  \ae@tok@master=\expandafter{\the\ae@tok@master & \noexpand\usebox{#3}}%%
  }

\makeatother

\begin{document}

        \setlength\aelength{\dimexpr0.97\linewidth-3ex}%%
        \begin{lrbox}\aepic
          \setlength\tabcolsep{0.5pt}%%
          \begin{tabular}[t]{c@{\hspace{1em}}cccc}
             \rule[-4ex]{0pt}{1pt}%% a vertical strut to get horizontal line under labels
              & label1 & label2 & label3 & label4 \\
              \aejustrow{vlable 1}{%%
                {[trim=0.0cm 0.0cm 0 0,clip,width=0.249\aelength]}{image1.pdf}{\aepicA};
                {[trim=1.1cm 0.0cm 0 0,clip,width=0.230\aelength]}{image2.pdf}{\aepicB};
                {[trim=1.1cm 0.0cm 0 0,clip,width=0.230\aelength]}{image3.pdf}{\aepicC};
                {[trim=1.1cm 0.0cm 0 0,clip,width=0.230\aelength]}{image4.pdf}{\aepicD}} \\
              \aejustrow{vlable 2}{%%
                {[trim=0.0cm 0.0cm 0 0,clip,width=0.249\aelength]}{image5.pdf}{\aepicA};
                {[trim=1.1cm 0.0cm 0 0,clip,width=0.230\aelength]}{image6.pdf}{\aepicB};
                {[trim=1.1cm 0.0cm 0 0,clip,width=0.230\aelength]}{image7.pdf}{\aepicC};
                {[trim=1.1cm 0.0cm 0 0,clip,width=0.230\aelength]}{image8.pdf}{\aepicD}} \\
              \aejustrow{vlable 3}{%%
                {[trim=0.0cm 0.0cm 0 0,clip,width=0.249\aelength]}{image9.pdf}{\aepicA};
                {[trim=1.1cm 0.0cm 0 0,clip,width=0.230\aelength]}{image10.pdf}{\aepicB};
                {[trim=1.1cm 0.0cm 0 0,clip,width=0.230\aelength]}{image11.pdf}{\aepicC};
                {[trim=1.1cm 0.0cm 0 0,clip,width=0.230\aelength]}{image12.pdf}{\aepicD}} \\
              \aejustrow{vlable 4}{%%
                {[trim=0.0cm 0.0cm 0 0,clip,width=0.249\aelength]}{image13.pdf}{\aepicA};
                {[trim=1.1cm 0.0cm 0 0,clip,width=0.230\aelength]}{image14.pdf}{\aepicB};
                {[trim=1.1cm 0.0cm 0 0,clip,width=0.230\aelength]}{image15.pdf}{\aepicC};
                {[trim=1.1cm 0.0cm 0 0,clip,width=0.230\aelength]}{image16.pdf}{\aepicD}}
          \end{tabular}
        \end{lrbox}%%

\begin{figure}
  \hspace{2em}\myxrightarrow{\dimexpr\wd\aepic -2.25em}\\[-0.4cm]%%
  \makebox[0pt][l]{\raisebox{-\height}[0pt][\dimexpr\height+\depth]
      {\hspace*{1em}\myxdownarrow{\dimexpr\ht\aepic+\dp\aepic-1ex\relax}}}%%
  \raisebox{-\height}[0pt][\dimexpr\height+\depth]{\usebox\aepic}%%
\end{figure}

\end{document}

This solution still doesn't feel fully satisfactory to me. It seems to rigidly tied to one particular way of presenting the images and lacks the sort of flexibility I prefer. Getting things to cooperate is a headache. Nevertheless, I do hope this helps you produce the result you desired.
All of this work really feels like reinventing the wheel: there is potentially a lot of work needed to muck around in the innards of LaTeX.
There are lots of other packages available to help with such mark up. JohnKormylo shows you how to do this with a picture environment. Something similar could also be done using pstricks. I'd like to sell you on TikZ though. So that's what I'll look at for the rest of this posting.
Part 2: The Bugaboo of TikZ
So, I know you said you didn't want to use TikZ. But, unless you have constraints coming from a publisher or advisor..., I feel you can get this done very easily and cleanly using TikZ. So, here is my TikZ version of a solution. I explain what I've done after the code for this solution.
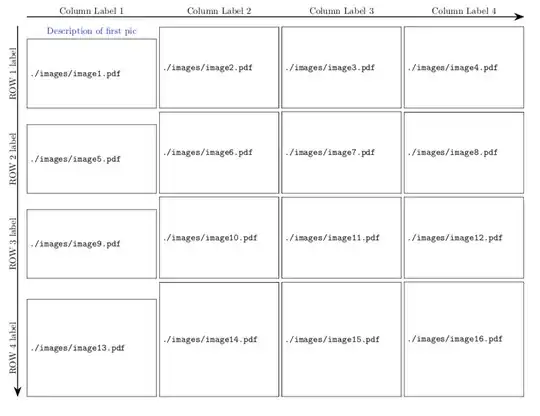
Here's the code to produce this
\documentclass{article}
\usepackage[draft]{graphicx}
\usepackage{amsmath}
\usepackage[showframe,margin=0.1in]{geometry}
\graphicspath{{./images/}}

\usepackage{tikz}
\usetikzlibrary{calc,fit,arrows.meta}
\newlength\aelength
\newbox\aepic

\newcommand\aegraphic[3][]  {%%
  \tikz[remember picture,overlay] \node (#2/BL) {};%%
  \tikz \node[anchor=south west,inner sep=0pt] (#2) at (#2/BL) {\includegraphics[#1]{#3}};%%
  }

\begin{document}

\setlength\aelength{\dimexpr\linewidth-3em}%%
\begin{figure}
  \setlength\tabcolsep{1.5pt}%%
  \hspace*{3em}%%
  \begin{tabular}[t]{cccc}
      \aegraphic[trim=0.0cm 1.1cm 0 0,clip,width=0.249\aelength]{A1}{{image1}.pdf} &
      \aegraphic[trim=1.1cm 1.1cm 0 0,clip,width=0.230\aelength]{A2}{{image2}.pdf} &
      \aegraphic[trim=1.1cm 1.1cm 0 0,clip,width=0.230\aelength]{A3}{{image3}.pdf} &
      \aegraphic[trim=1.1cm 1.1cm 0 0,clip,width=0.230\aelength]{A4}{{image4}.pdf}\\
      %% ------------------------------------------------------------------------------------
      \aegraphic[trim=0.0cm 1.1cm 0 0,clip,width=0.249\aelength]{B1}{{image5}.pdf} &
      \aegraphic[trim=1.1cm 1.1cm 0 0,clip,width=0.230\aelength]{B2}{{image6}.pdf} &
      \aegraphic[trim=1.1cm 1.1cm 0 0,clip,width=0.230\aelength]{B3}{{image7}.pdf} &
      \aegraphic[trim=1.1cm 1.1cm 0 0,clip,width=0.230\aelength]{B4}{{image8}.pdf}\\
      %% ------------------------------------------------------------------------------------
      \aegraphic[trim=0.0cm 1.1cm 0 0,clip,width=0.249\aelength]{C1}{{image9}.pdf}  &
      \aegraphic[trim=1.1cm 1.1cm 0 0,clip,width=0.230\aelength]{C2}{{image10}.pdf} &
      \aegraphic[trim=1.1cm 1.1cm 0 0,clip,width=0.230\aelength]{C3}{{image11}.pdf} &
      \aegraphic[trim=1.1cm 1.1cm 0 0,clip,width=0.230\aelength]{C4}{{image12}.pdf}\\
      %% ------------------------------------------------------------------------------------
      \aegraphic[trim=0.0cm 0.0cm 0 0,clip,width=0.249\aelength]{D1}{{image13}.pdf} &
      \aegraphic[trim=1.1cm 0.0cm 0 0,clip,width=0.230\aelength]{D2}{{image14}.pdf} &
      \aegraphic[trim=1.1cm 0.0cm 0 0,clip,width=0.230\aelength]{D3}{{image15}.pdf} &
      \aegraphic[trim=1.1cm 0.0cm 0 0,clip,width=0.230\aelength]{D4}{{image16}.pdf}
  \end{tabular}%%
  \begin{tikzpicture}[remember picture,overlay]
      \node[fit=(A1) (A2) (A3) (A4)
                (B1) (B2) (B3) (B4)
                (C1) (C2) (C3) (C4)
                (D1) (D2) (D3) (D4),
                inner sep=0pt,
                ] (PIC) {};

      \draw[line width=1pt,arrows={-Stealth[length=4mm]}] ([xshift=-1em]PIC.north west) -- ([xshift=-1em]PIC.south west);
      \draw[line width=1pt,arrows={-Stealth[length=4mm]}] ([yshift=1em]PIC.north west) -- ([yshift=1em]PIC.north east);

      \node[anchor=south] (COL1/label) at ([yshift=1em]A1|-PIC.north) {Column Label  1};
      \node[anchor=south] (COL2/label) at ([yshift=1em]A2|-PIC.north) {Column Label  2};
      \node[anchor=south] (COL3/label) at ([yshift=1em]A3|-PIC.north) {Column Label  3};
      \node[anchor=south] (COL4/label) at ([yshift=1em]A4|-PIC.north) {Column Label  4};

      \node[anchor=center,rotate=90] (ROW1/label) at ([xshift=-1.5em]A1-|PIC.west) {ROW 1 label};
      \node[anchor=center,rotate=90] (ROW2/label) at ([xshift=-1.5em]B1-|PIC.west) {ROW 2 label};
      \node[anchor=center,rotate=90] (ROW3/label) at ([xshift=-1.5em]C1-|PIC.west) {ROW 3 label};
      \node[anchor=center,rotate=90] (ROW4/label) at ([xshift=-1.5em]D1-|PIC.west) {ROW 4 label};

      \node[blue,anchor=south] at (A1.north) {Description of first pic};

  \end{tikzpicture}
\end{figure}

\end{document}
Explanation of TikZ solution
I'm trying to minimize your headaches with TikZ here. The key here is two-fold: using a overlays and fitting.
I still use the tabular environment for laying out the picture. This could be done in a Tikz Picture. But, since I don't know all your potential constraints, I've forgone making the entire figure that way. In particular, I don't know how you want to handle the alignment pictures of unequal height or width.
Each cell of tabular tabular environment has three things going on:
- A TikZ mark is created. This is to help us later remember where the picture is.
- Using the TikZ mark, another TikZ node is created in which the image is going to be placed. This will give us information about where the edges of the picture are that a TikZ mark doesn't provide.
- I define a command
\aegraphic to simplify things a bit. And, it makes the code more readable. This command takes three arguments. The first is optional and contains the key values you want to pass along to \includegraphics, the second argument is the name of the node in which you'll be placing the graphic, and the third argument is name of the image file.
Once the table of images is created, I create a PIC node to fit all the nodes of each individual graphic used. Now I can easily determine where the arrows along the top and left of the image should be place. I can also easily place labels adjacent to rows (properly rotated) and above each column.
The key points of TikZ that I use are the following:
- Anchoring: this helps us place the elements of the picture relative to each other without know exactly where they are.
- Rotation: rotation happens around the anchor of the node.
- The
(<node_A>-|<node_B>) syntax: this grabs the y coordinate from node A and the x coordinate of node B. Similarly (<node_A>|-<node_B>) just flips this around.
- The
([<options>]node-name) syntax: this allows fine tuning such as displacing the arrows along the edges of the image relative to the nodes defined by the table.
remember picture,overlay syntax: this is telling TikZ to remember where this picture is being placed, essentially allowing you to place the TikZ picture wherever you would like on the page irrespective of other content.
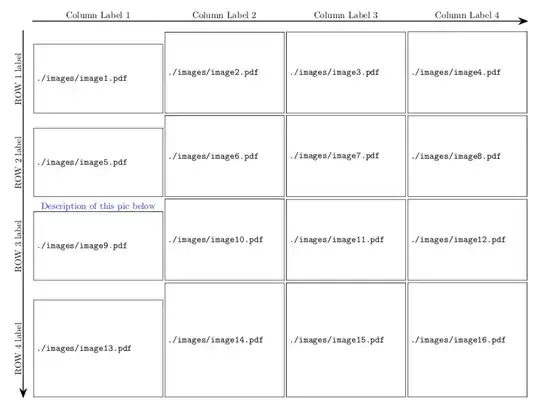
Part 3: a fully TikZ solution
What's nice about this solution is using the TikZ matrix construct is very similar to using the tabular environment. So, that means there's not too much more to learn there. Also, overlays can be annoying since they can intrude into other parts of your document, which means you have to go in and manually fix things. In this entirely TikZ solution, no such manual tweaking should be necessary. And, other than using the \matrix command provided in the TikZ bundle, nothing else changes. I probably do not need to use the fitting library here, but I have to run off to work and so I will leave that up to later to contemplate.
One issue I do have with the tabular environment approach is that, while setting the distance between columns is fairly straight-forward, there is no simple way to control to the same degree the distance between rows (at least I'm not aware of any, tell me about it in the comments if I'm wrong). But, even if there were such a control, within TikZ I can easily control the presentation of the spacing around images with one key inner sep=1pt or whatever other value one wishes.
The code for this solution:
\documentclass{article}
\usepackage[draft]{graphicx}
\usepackage[showframe,margin=0.1in]{geometry}
\graphicspath{{./images/}}

\usepackage{tikz}
\usetikzlibrary{calc,fit,arrows.meta}
\newlength\aelength

\begin{document}

\begin{figure}
  \setlength\aelength{\dimexpr\linewidth-3em}%%
  \centering
  \begin{tikzpicture}

  \matrix[nodes={anchor=south west,inner sep=1pt}]{
    \node (A1) {\includegraphics[trim=0.0cm 1.1cm 0 0,clip,width=0.249\aelength]{{image1}.pdf}};  &
    \node (A2) {\includegraphics[trim=1.1cm 1.1cm 0 0,clip,width=0.230\aelength]{{image2}.pdf}};  &
    \node (A3) {\includegraphics[trim=1.1cm 1.1cm 0 0,clip,width=0.230\aelength]{{image3}.pdf}};  &
    \node (A4) {\includegraphics[trim=1.1cm 1.1cm 0 0,clip,width=0.230\aelength]{{image4}.pdf}}; \\
    \node (B1) {\includegraphics[trim=0.0cm 1.1cm 0 0,clip,width=0.249\aelength]{{image5}.pdf}}; &
    \node (B2) {\includegraphics[trim=1.1cm 1.1cm 0 0,clip,width=0.230\aelength]{{image6}.pdf}}; &
    \node (B3) {\includegraphics[trim=1.1cm 1.1cm 0 0,clip,width=0.230\aelength]{{image7}.pdf}}; &
    \node (B4) {\includegraphics[trim=1.1cm 1.1cm 0 0,clip,width=0.230\aelength]{{image8}.pdf}}; \\
    \node (C1) {\includegraphics[trim=0.0cm 1.1cm 0 0,clip,width=0.249\aelength]{{image9}.pdf} }; &
    \node (C2) {\includegraphics[trim=1.1cm 1.1cm 0 0,clip,width=0.230\aelength]{{image10}.pdf}}; &
    \node (C3) {\includegraphics[trim=1.1cm 1.1cm 0 0,clip,width=0.230\aelength]{{image11}.pdf}}; &
    \node (C4) {\includegraphics[trim=1.1cm 1.1cm 0 0,clip,width=0.230\aelength]{{image12}.pdf}}; \\
    \node (D1) {\includegraphics[trim=0.0cm 0.0cm 0 0,clip,width=0.249\aelength]{{image13}.pdf}}; &
    \node (D2) {\includegraphics[trim=1.1cm 0.0cm 0 0,clip,width=0.230\aelength]{{image14}.pdf}}; &
    \node (D3) {\includegraphics[trim=1.1cm 0.0cm 0 0,clip,width=0.230\aelength]{{image15}.pdf}}; &
    \node (D4) {\includegraphics[trim=1.1cm 0.0cm 0 0,clip,width=0.230\aelength]{{image16}.pdf}}; \\
  };

  \node[fit=(A1) (A2) (A3) (A4)
            (B1) (B2) (B3) (B4)
            (C1) (C2) (C3) (C4)
            (D1) (D2) (D3) (D4),
            inner sep=0pt,
            ] (PIC) {};

  \draw[line width=1pt,arrows={-Stealth[length=4mm]}] ([xshift=-1em]PIC.north west) -- ([xshift=-1em]PIC.south west);
  \draw[line width=1pt,arrows={-Stealth[length=4mm]}] ([yshift=1em]PIC.north west) -- ([yshift=1em]PIC.north east);

  \node[anchor=south] (COL1/label) at ([yshift=1em]A1|-PIC.north) {Column Label  1};
  \node[anchor=south] (COL2/label) at ([yshift=1em]A2|-PIC.north) {Column Label  2};
  \node[anchor=south] (COL3/label) at ([yshift=1em]A3|-PIC.north) {Column Label  3};
  \node[anchor=south] (COL4/label) at ([yshift=1em]A4|-PIC.north) {Column Label  4};

  \node[anchor=center,rotate=90] (ROW1/label) at ([xshift=-1.5em]A1-|PIC.west) {ROW 1 label};
  \node[anchor=center,rotate=90] (ROW2/label) at ([xshift=-1.5em]B1-|PIC.west) {ROW 2 label};
  \node[anchor=center,rotate=90] (ROW3/label) at ([xshift=-1.5em]C1-|PIC.west) {ROW 3 label};
  \node[anchor=center,rotate=90] (ROW4/label) at ([xshift=-1.5em]D1-|PIC.west) {ROW 4 label};

  \node[blue,anchor=south,inner sep=0pt] at (C1.north) {Description of this pic below};

\end{tikzpicture}
\end{figure}

\end{document}


example-image-duck,example-image,example-image-a,example-image-b(to name a few). – Skillmon Sep 29 '18 at 17:30tikzis the metaphorical cannon to this fly of a problem (or so I thought?). – kabanus Sep 29 '18 at 18:13