Modified from the good answer of the friendly creature named marmot https://tex.stackexchange.com/a/471670/191410
\documentclass[tikz,border=3.14mm]{standalone}
\usepackage{tikz-3dplot}
\usetikzlibrary{3d}
\begin{document}
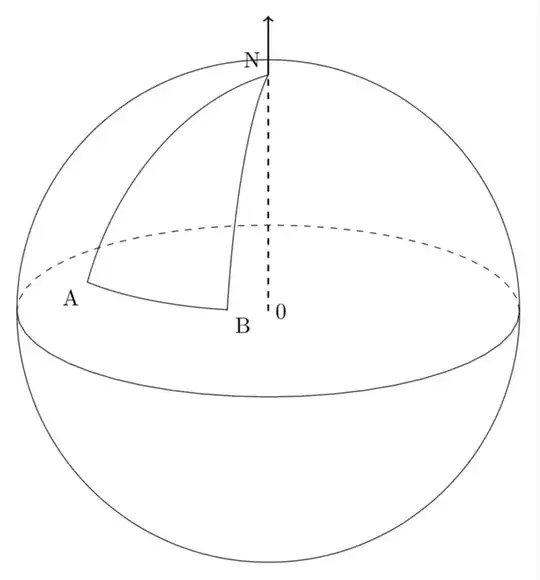
\tdplotsetmaincoords{90}{-30}
\begin{tikzpicture}[tdplot_main_coords]
\pgfmathsetmacro{\Radius}{4}
\pgfmathsetmacro{\radius}{3.6}
\draw[tdplot_screen_coords] (0,0) circle (\Radius);
\begin{scope}
\draw plot[variable=\x,domain=-20:20] (xyz spherical cs:radius=\Radius,latitude=20,longitude=\x)
-- plot[variable=\x,domain=20:90] (xyz spherical cs:radius=\Radius,latitude=\x,longitude=20)
-- plot[variable=\x,domain=90:20] (xyz spherical cs:radius=\Radius,latitude=\x,longitude=-20);
\end{scope}
\draw[thick,->] (0,0,0) -- (0,0,5);
\draw[tdplot_screen_coords,dashed] (0,0) ellipse (4 and 0.5);
\node[anchor=north east] at (xyz spherical cs:radius=\Radius,latitude=20,longitude=-20) {A};
\node[anchor=north west] at (xyz spherical cs:radius=\Radius,latitude=20,longitude=20) {B};
\node[anchor=south east] at (xyz spherical cs:radius=\Radius,latitude=90,longitude=-20) {N};
\node[anchor=west] at (xyz spherical cs:radius=0,latitude=0,longitude=0) {0};
\end{tikzpicture}
\end{document}

Or
\documentclass[tikz,border=3.14mm]{standalone}
\usepackage{tikz-3dplot}
\begin{document}
\tdplotsetmaincoords{110}{-30}
\begin{tikzpicture}[tdplot_main_coords]
 \pgfmathsetmacro{\Radius}{4}
 \draw[tdplot_screen_coords] (0,0) circle (\Radius);
 \begin{scope}
  \draw plot[variable=\x,domain=-20:20] (xyz spherical cs:radius=\Radius,latitude=20,longitude=\x)
  -- plot[variable=\x,domain=20:90] (xyz spherical cs:radius=\Radius,latitude=\x,longitude=20)
  -- plot[variable=\x,domain=90:20] (xyz spherical cs:radius=\Radius,latitude=\x,longitude=-20);
 \end{scope}
 \draw[thick,dashed] (0,0,0) -- (0,0,\Radius);
 \draw[thick,->] (0,0,\Radius) -- (0,0,5);
 \draw[dashed] plot[variable=\x,domain=90-\tdplotmainphi:270-\tdplotmainphi]
 (xyz spherical cs:radius=\Radius,latitude=0,longitude=\x);
 \draw plot[variable=\x,domain=90-\tdplotmainphi:-90-\tdplotmainphi]
 (xyz spherical cs:radius=\Radius,latitude=0,longitude=\x);
 \node[anchor=north east] at (xyz spherical cs:radius=\Radius,latitude=20,longitude=-20) {A};
 \node[anchor=north west] at (xyz spherical cs:radius=\Radius,latitude=20,longitude=20) {B};
 \node[anchor=south east] at (xyz spherical cs:radius=\Radius,latitude=90,longitude=-20) {N};
 \node[anchor=west] at (xyz spherical cs:radius=0,latitude=0,longitude=0) {0};
\end{tikzpicture}
\end{document}