With use of the nicematrix package, designed as unnumbered equation:

\documentclass{article}
\usepackage{mathtools}
\usepackage{nicematrix,tikz}
\usetikzlibrary{fit,shapes.geometric}
\tikzset{highlight/.style={ellipse, draw=red, semithick, inner sep=1pt}}
\begin{document}
[
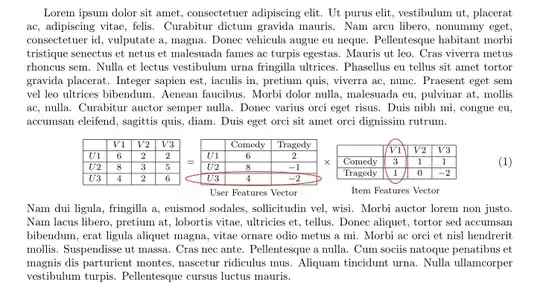
\begin{NiceMatrix}[hvlines]
& V1 & V2 & V3 \
U1 & 6 & 2 & 2 \
U2 & 8 & 3 & 5 \
U3 & 4 & 2 & 6 \
\end{NiceMatrix}
\quad=\quad
\begin{NiceMatrix}[hvlines]
& \text{Comedy}
& \text{Tragedy}\
U1 & 6 & 2 \
U2 & 8 & -1 \
U3 & 4 & -2 \
\CodeAfter
\tikz \node [highlight, fit=(4-1) (4-3),
label=below:User Features Vector] {} ;
\end{NiceMatrix}
\quad\times\quad
\begin{NiceMatrix}[hvlines]
& V1 & V2 & V3 \
\text{Comedy}
& 3 & 1 & 1 \
\text{Tragedy}
& 1 & 0 & -2 \
\CodeAfter
\tikz \node [highlight, fit=(1-2) (3-2),
label=below:Item Features Vector] {};
\end{NiceMatrix}
]
\end{document}
Note: for the showed result you need to compile MWE at least twice!
Addendum:*
- From your comments follows, that you like to have such solution in documents using
standalone document class. Unfortunately this document class not support well images or writing equations which are based on remember picture and overlay options (as far as i know).
- On the other hand, it is not clear what benefits are expected to have one equation (combined with
tikz drawings in form of nicematrix or for example with tikzmark nodes). To include it as pdf or png file which you can simple scale?
- Reason, that you can include in other environments, for example in float, is not convincing. this can be done directly. For example in
figure float:
\documentclass{article}
\usepackage{geometry}
\usepackage{mathtools}
\usepackage{nicematrix,tikz}
\usetikzlibrary{fit,shapes.geometric}
\tikzset{highlight/.style={ellipse, draw=red, semithick, inner sep=1pt}}
\usepackage{lipsum}
\begin{document}
\lipsum[1]
\begin{figure}[htb]
    [
\begin{NiceMatrix}[hvlines]
    & V1    & V2    & V3    \
U1  & 6     & 2     & 2     \
U2  & 8     & 3     & 5     \
U3  & 4     & 2     & 6     \
    \end{NiceMatrix}
\quad=\quad
\begin{NiceMatrix}[hvlines]
    & \text{Comedy}
            & \text{Tragedy}\

U1  & 6     & 2             \

U2  & 8     & -1            \

U3  & 4     & -2            \

\CodeAfter
\tikz \node [highlight, fit=(4-1) (4-3),
             label=below:User Features Vector] {} ;
\end{NiceMatrix}
\quad\times\quad
\begin{NiceMatrix}[hvlines]
    & V1    & V2    & V3    \

\text{Comedy}
    & 3     & 1     & 1     \

\text{Tragedy}
    & 1     & 0     & -2    \

\CodeAfter
\tikz \node [highlight, fit=(1-2) (3-2),
             label=below:Item Features Vector] {} ;
\end{NiceMatrix}
]
\caption{For some reason this equation is present as figure}
\label{fig:nicematrix}
\end{figure}
\lipsum[2]
\end{document}
which gives:

- In the case, that the equation is to big (as it is now, it is wider than default text width defined by
article document class), you can use for it smaller fonts or macro \medmath defined in the nccmath package:
\documentclass{article}
\usepackage{geometry}
\usepackage{mathtools, nccmath}
\usepackage{nicematrix,tikz}
\usetikzlibrary{fit,
                shapes.geometric}
\tikzset{highlight/.style={ellipse, draw=red, semithick, inner sep=1pt}}
\usepackage{lipsum}
\begin{document}
\lipsum[1]
    \begin{equation}\medmath{
\begin{NiceMatrix}[hvlines]
    & V1    & V2    & V3    \
U1  & 6     & 2     & 2     \
U2  & 8     & 3     & 5     \
U3  & 4     & 2     & 6     \
    \end{NiceMatrix}
\quad=\quad
\begin{NiceMatrix}[hvlines]
    & \text{Comedy}
            & \text{Tragedy}\

U1  & 6     & 2             \

U2  & 8     & -1            \

U3  & 4     & -2            \

\CodeAfter
\tikz \node [highlight, fit=(4-1) (4-3),
             label=below:User Features Vector] {} ;
\end{NiceMatrix}
\quad\times\quad
\begin{NiceMatrix}[hvlines]
    & V1    & V2    & V3    \

\text{Comedy}
    & 3     & 1     & 1     \

\text{Tragedy}
    & 1     & 0     & -2    \

\CodeAfter
\tikz \node [highlight, fit=(1-2) (3-2),
             label=below:Item Features Vector] {} ;
\end{NiceMatrix}
    }
\medskip
    \end{equation}
\lipsum[2]
\end{document}
If you for some reason like to retype this equation meny times in document, you can store equation code in file and simple call it with for example
\input{equations/nicematrix-1}
where nicematrix-1 is name of the file with equation code stored in equations sub folder in your document folder.
if there is still some reason to have this equation as standalone document, than might be solution to draw it with plain tikz using matrix library. Code for such image can be "slightly" more complicated (see second mine answer).


