Motivation
The current accepted answer doesn't explain why
Dimension too largerestrict y to domain doesn't work in OP's example.
Moreover, it mainly relies on hard-coding to chop the curve's x domain (that I simply call "domain" for the rest of this paragraph). We have to view the graph first (in a visual/analytical way) before being able to choose a suitable domain. A (polynomial/exponential) curve can increase/decrease rapidly on the right/left part of the whole graph. It's not trivial to instruct a machine to automatically crop a suitable domain.
Discussion
I'll analyse the error in three parts:
- minimum problematic example (MPE)
- maximum PGF dimensions
- brief explanation about
restrict y to domain
MPE
Most of the lines in the generated TikZ code is good. In other words, those correct lines can be discarded without affecting the error message.
\documentclass{standalone}
\usepackage{pgfplots}
\pgfplotsset{compat=1.18}
\begin{document}
\begin{tikzpicture}
\begin{axis}[
  xmin=-5,
  xmax=13.6,
  ymin=-5,
  ymax=6.55,
]
  \clip (-5,-5) rectangle (13.6,6.55);
  \draw (-4.9,-4.9) rectangle (13.3,6.5);
  \draw[domain=-5:13.6] plot (\x,{1/2*(\x)^3-2*\x});
\end{axis}
\end{tikzpicture}
\end{document}
Some minor differences between my MPE and your code:
\documentclass is standalone instead of article to zoom into the picture and remove the unnecessary surrounding whitespace.compat=1.18 instead of compat=1.15 as my PDFLaTeX suggests.- numbers rounded to two decimal places for easier reading.
- I've taken away
restrict y to domain={...} here. Even though you add that back to my MPE, the compiler will give the same error. I'll elaborate on that in the last subsection of this section.
- I've removed
x=1cm and y=1cm in both \begin{tikzpicture} and \begin{axis}, but that's fine since those are the default values in TikZ and PGF Plots.
I'll leave the visual output of
pdftoppm -png graph.pdf > graph.png
to the next subsection.
At this point, we see that this question is not about geogebra, because the above MPE can be constructed without the Geometry suite.
Maximum PGF dimensions
The accepted answer of a relevant question \usepgflibrary{fpu} to show that 600cm is greater than \maxdimen, which is the greatest possible value of TeX-dimensions. \maxdimen is (2^14-2e-5)pt = 16383.99998pt, but 600cm is greater than 17000pt, so using 600cm as a length would trigger the error Dimension too large.

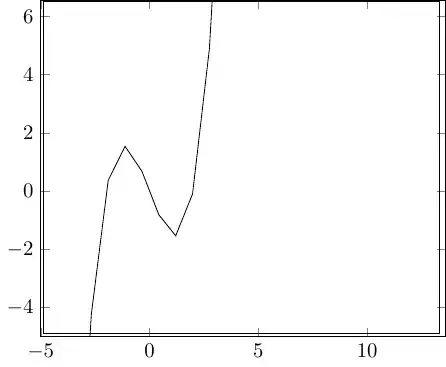
The given cubic curve is defined as y = x³/2 - 2x on [-5,13.6]. When x = 13, y = 1072.5 > 600. Since x=1cm and y=1cm by default, when the y-coordinate 1072.5cm is converted to pt, it will exceed \maxdimen, causing the error.
brief explanation about restrict y to domain
The key is found in (section 4.22 Skipping or changing coordinates – filters of) PGF Plots manual, but not in TikZ manual. I tried putting this behind \draw[], the system didn't recognize the key /tikz/restrict y to domain. I also tried putting this behind plot, but that didn't help, becuase \draw is a TikZ command instead of a PGF Plots one.
When you put restrict y to domain inside \begin{axis}, this PGF Plots key will be applied to every \addplot (or \addplot+) inside this axis environment, but not on \draw elements.
Solution
I'll first solve my simpler problem, before actually solving yours.
MPE
Convert \draw[domain={...}] plot (\x,{...}); into \addplot[domain={...}] (x,{...});.
\documentclass{standalone}
\usepackage{pgfplots}
\pgfplotsset{compat=1.18}
\begin{document}
\begin{tikzpicture}
\begin{axis}[
  xmin=-5,
  xmax=13.6,
  ymin=-5,
  ymax=6.55,
  restrict y to domain=-5:6.55,
]
  \clip (-5,-5) rectangle (13.6,6.55);
  \draw (-4.9,-4.9) rectangle (13.3,6.5);
  \addplot[domain=-5:13.6] (x,{1/2*(x)^3-2*x});
\end{axis}
\end{tikzpicture}
\end{document}

The limit isn't fully used, but at least the compiler is no longer complaining.
To stretch the curve, I found that [3*ymin,3*ymax] is a suitable y domain. I don't know that the scaling factor 2 doesn't work here.
This approach is much easier to program: you can (regex) search for the occurrence of \begin{axis}[, then inject the line "restrict y to domain=xxx:yyy". You can develop your function to calculate the upper and lower limits xxx and yyy from ymin and ymax, whose numerical values can be programmatically extracted. For example, I've simply multiplied both numbers by 3.
Original example
I only changed two lines of your code containing \draw [...] plot (\x,{...}) to \addplot [...] (x,{...}) with \x replaced by x without touching what's inside the square bracket [...].
\documentclass[10pt]{article}
\usepackage{pgf,tikz,pgfplots}
\pgfplotsset{compat=1.15}
\usepackage{mathrsfs}
\usetikzlibrary{arrows}
\pagestyle{empty}
\begin{document}
\begin{tikzpicture}[line cap=round,line join=round,>=triangle 45,x=1.0cm,y=1.0cm, scale = 1.2, transform shape]
\begin{axis}[
x=1.0cm,y=1.0cm,
axis lines=middle,
xmin=-1.129485186780251,
xmax=5.72744433329757,
ymin=-0.96997054991852,
ymax=5.616499082403562,
xtick={0.0},
ytick={0.0}, restrict y to domain=-0.96997054991852:5.616499082403562,]
\clip(-1.129485186780251,-0.76997054991852) rectangle (5.82744433329757,5.916499082403562);
\addplot[line width=0.8pt,smooth,samples=100,domain=-3.129485186780251:10.42744433329757] (x,{(x)-2.25E-50});
\addplot[line width=0.8pt,smooth,samples=100,domain=-3.129485186780251:10.42744433329757] (x,{0-0.07123888916965247*(x)^(4.0)+1.5096421986752417*(x)^(3.0)-9.579592272284225*(x)^(2.0)+23.93776936035761*(x)-17.586966972004486});
\draw (5.196549774492815,0.49322601353710884) node[anchor=north west] {$x$};
\draw (0.020629571335991016,5.575885328535428) node[anchor=north west] {$f(x)$};
\draw [line width=0.8pt,dash pattern=on 2pt off 2pt] (1.5,1.5)-- (1.5,0.);
\draw [line width=0.8pt,dash pattern=on 2pt off 2pt] (3.,0.)-- (3.,3.);
\draw [line width=0.8pt,dash pattern=on 2pt off 2pt] (4.5,4.5)-- (4.501485877435332,0.);
\draw (1.2137496293807978,0.021729881572188525) node[anchor=north west] {$x_0$};
\draw (2.700437452518166,0.021729881572188525) node[anchor=north west] {$x_1$};
\draw (4.228710949030006,0.021729881572188525) node[anchor=north west] {$x_2$};
\begin{scriptsize}
\draw [fill=black] (1.5,1.5) circle (1.2pt);
\draw [fill=black] (4.5,4.5) circle (1.2pt);
\draw [fill=black] (3.,3.) circle (1.2pt);
\end{scriptsize}
\end{axis}
\end{tikzpicture}
\end{document}
Observe that your graph is very small in the middle.

TODO
Time to work on some string manipulations to:
- round every decimal to two decimal places if necessary
- replace
[10pt]{article} to {standalone} to make the output image larger.
- inject the
restrict y domain={...}, to avoid Dimensions too large.


axisenvironment there are only plain TikZ commands. What is the purpose of this? That is, what do you need theaxisfor here? – Aug 17 '19 at 12:23axisenvironment. – offline Aug 17 '19 at 13:07