Since I could not reproduce any "undefined control sequence" error message with the updated example code, I focused on the flaws in the output. Here are therefore 4 different tables using different font sizes ans alignments while keeping the original style of the table unchanged:

\documentclass[12pt,listof=totoc,bibliography=totoc,numbers=noenddot]{scrartcl}
\usepackage[table]{xcolor}
\usepackage{calc}
\usepackage{tabularx}
\renewcommand{\tabularxcolumn}[1]{m{#1}}
\usepackage{siunitx}
\begin{document}
\begin{table}[hbt]
\centering
\captionabove{Initial assumed values - smaller font size, tabularx, equal column widths}
\small \setlength{\tabcolsep}{5pt}
\begin{tabularx}{\textwidth}{|X|*{11}{>{\centering\arraybackslash}m{\widthof{99.9}}|}}\hline
Parameter            & {80}   & {84}  & {88}   & {92}  & {93}   & {96}   & {100} & {104}   & {108}   & {112}  & {116} \\ \hline\hline
Cellular bacteria(\%)      & \cellcolor{blue!25}86.5   & 62.5   & 56.3   & 37.5   & 50   & 50   & 37.5 & \cellcolor{blue!25}87.5   & 37.5  & \cellcolor{blue!25}75  & 66.7 \\\hline
\end{tabularx}
\end{table}


\begin{table}[hbt]
\centering
\captionabove{Initial assumed values - normal font size, tabularx, equal column width, vertically centered numbers}
\begin{tabularx}{\textwidth}{|>{\raggedright\arraybackslash}X|*{11}{>{\centering\arraybackslash}m{\widthof{99.9}}|}}\hline
Parameter            & {80}   & {84}  & {88}   & {92}  & {93}   & {96}   & {100} & {104}   & {108}   & {112}  & {116} \\ \hline\hline
Cellular bacteria(\%)      & \cellcolor{blue!25}86.5   & 62.5   & 56.3   & 37.5   & 50   & 50   & 37.5 & \cellcolor{blue!25}87.5   & 37.5  & \cellcolor{blue!25}75  & 66.7 \\\hline
\end{tabularx}
\end{table}


\begin{table}[hbt]
\centering
\captionabove{Initial assumed values - normal font size, unequal column widths, tabularx}
\begin{tabularx}{\textwidth}{|>{\raggedright\arraybackslash}X|*{11}{c|}}\hline
Parameter            & {80}   & {84}  & {88}   & {92}  & {93}   & {96}   & {100} & {104}   & {108}   & {112}  & {116} \\ \hline\hline
Cellular bacteria(\%)      & \cellcolor{blue!25}86.5   & 62.5   & 56.3   & 37.5   & 50   & 50   & 37.5 & \cellcolor{blue!25}87.5   & 37.5  & \cellcolor{blue!25}75  & 66.7 \\\hline
\end{tabularx}
\end{table}

\begin{table}[hbt]
\centering
\captionabove{Initial assumed values - normal font size, tabularx, equal column widths, alignment of numbers with siunitx}
\begin{tabularx}{\textwidth}{|>{\raggedright\arraybackslash}X|*{11}{S[table-format=2.1]|}}\hline
Parameter            & {80}   & {84}  & {88}   & {92}  & {93}   & {96}   & {100} & {104}   & {108}   & {112}  & {116} \\ \hline\hline
Cellular bacteria(\%)      & \cellcolor{blue!25}86.5   & 62.5   & 56.3   & 37.5   & 50   & 50   & 37.5 & \cellcolor{blue!25}87.5   & 37.5  & \cellcolor{blue!25}75  & 66.7 \\\hline
\end{tabularx}
\end{table}
\end{document}
Here is also another suggestion on how you could design your table based on booktabs and without the use of color:
\documentclass[12pt,listof=totoc,bibliography=totoc,numbers=noenddot]{scrartcl}
\usepackage{tabularx}
\usepackage{siunitx}
\usepackage{etoolbox}
\robustify\bfseries
\usepackage{booktabs}
\begin{document}
\begin{table}[hbt]
\centering
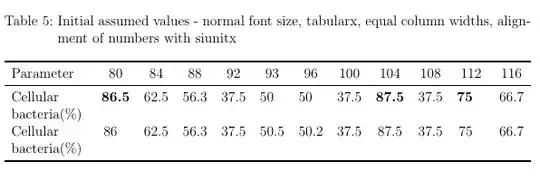
\captionabove{Initial assumed values - normal font size, tabularx, equal column widths, alignment of numbers with siunitx, no vertical lines, horizontal lines from booktabs, no color but bold instead to highlight numbers}
\begin{tabularx}{\textwidth}{>{\raggedright\arraybackslash}X*{11}{S[table-format=2.1,detect-weight]}}
\toprule
Parameter & {80} & {84} & {88} & {92} & {93} & {96} & {100} & {104} & {108} & {112} & {116} \\
\midrule
Cellular bacteria(\%) & \bfseries 86.5 & 62.5 & 56.3 & 37.5 & 50 & 50 & 37.5 & \bfseries 87.5 & 37.5 & \bfseries 75 & 66.7 \\
Cellular bacteria(\%) & 86 & 62.5 & 56.3 & 37.5 & 50.5 & 50.2 & 37.5 & 87.5 & 37.5 & 75 & 66.7 \\
\bottomrule
\end{tabularx}
\end{table}
\end{document}


\captionaboveis a KOMA-script specific command. It thus does not work (and results in an undefined control sequence error) when used in stardard document classes. You might want to replace\documentclass{article}with\documentclass{scrartcl}or stay witharticleand use\caption{Initial assumed values}instead. – leandriis Nov 17 '19 at 09:56\captionabovefrom https://tex.stackexchange.com/a/22754. – Nov 17 '19 at 09:58\\\\Lastly, your table is a lot wider than the textwidth of a standardarticleclass document, even with smaller column widths. – leandriis Nov 17 '19 at 09:58