One part of your requirement straight from the book-- http://mirrors.ibiblio.org/CTAN/graphics/pgf/contrib/tikz-qtree/tikz-qtree-manual.pdf
\documentclass[11pt]{article}
\usepackage{tikz-qtree}

\begin{tikzpicture}
\tikzset{edge from parent/.style=
{draw,
edge from parent path={(\tikzparentnode.south)
-- +(0,-8pt)
-| (\tikzchildnode)}}}
\Tree [.S [.NP [.Det the ] [.N cat ] ]
[.VP [.V sat ]
[.PP [.P on ]
[.NP [.Det the ] [.N mat ] ] ] ] ]
\end{tikzpicture}
\end{document}
EDIT1
Node names can be moved by adding options such as [\edge node[xshift=20pt,yshift=5pt]{$y$};
Here y and pp have been shifted
\begin{tikzpicture}
\tikzset{edge from parent/.style={draw, edge from parent path={(\tikzparentnode.south) -- +(0,-8pt) -| (\tikzchildnode)}}}

\Tree [\edge node[xshift=20pt,yshift=5pt]{$y$}; [.NP [.Det the ] [.N cat ] ]
[.VP [.V sat ]
[\edge node[xshift=30pt,yshift=5pt]{$pp$};  [.P on ]
[.NP [.Det the ] [.N mat ] ] ] ] ]
\end{tikzpicture}

EDIT2
The first part of the requirement has been answered below -- a little adaptation will be required -- this is from the this same site answer on Jan 23, 2019 -- https://tex.stackexchange.com/a/525323/197451

\documentclass[border=5pt]{standalone}
\usepackage{pgfplots}
\pgfplotsset{
% use `compat' level 1.11 or higher so coordinates don't have to be
% prefixed with `axis cs:' (any more)
compat=1.11,
}
\begin{document}
\begin{tikzpicture}[
region/.style={
draw=black!50,
dashed,
},
Node/.style={
midway,
red,
},
declare function={
xmin=0;
xmax=12;
ymin=0;
ymax=300;
},
]
\begin{axis}[hide axis,
xlabel={},
ylabel={},
xmin=xmin,
xmax=xmax,
ymin=ymin,
ymax=ymax,
axis background/.style={},
extra x ticks={},
extra y ticks={},
title=title,
]
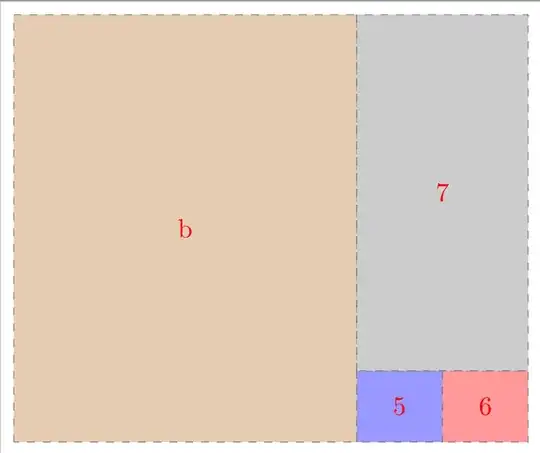
\draw [region,fill=brown!40] (xmin,ymin) rectangle (8,ymax) node [Node, xshift=-55, yshift=-76] {68\%};
\draw [region,fill=blue!40] (8,ymin) rectangle (10,50) node [Node, xshift=-10, yshift=-9] {5\%};
\draw [region,fill=red!40] (10,ymin) rectangle (xmax,50) node [Node, xshift=-10, yshift=-9] {5\%};
\draw [region,fill=gray!40] (8,50) rectangle (xmax,ymax) node [Node, xshift=-24, yshift=-64] {22\%};
\end{axis}
\end{tikzpicture}
\end{document}
After adaptation of the same code the OP can get the following ---