2

I have been trying to shift the x axis label in the axis environment down. With not much success... For some reason when I enter xlabel style={yshift=-1.5em} the whole thing doesn't even compile and throws a ! Missing number, treated as zero. at me. Please help.

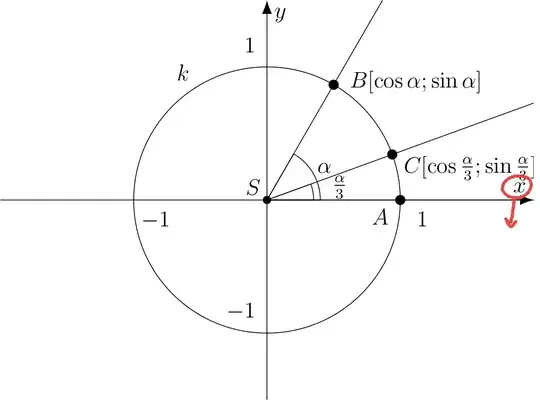
Here is the code, please ignore the messy coordinates. They were generated by Geogebra

\documentclass[tikz, border=2mm]{standalone}

\usepackage{pgfplots}
\pgfplotsset{compat=1.16}
\usetikzlibrary{arrows.meta}

\begin{document}   

\begin{tikzpicture}
\begin{axis}[
x=2.5cm,
y=2.5cm,
axis x line=middle,
axis y line=middle,
every inner x axis line/.append style={-{Latex[scale=1.5]}},
every inner y axis line/.append style={-{Latex[scale=1.5]}},
xmin=-2,
xmax=2,
ymin=-1.5,
ymax=1.5,
xtick={-1,0,1},
ytick={-1,0,1},
xlabel={$x$},
ylabel={$y$},
xlabel style={yshift=-1.5em},
xticklabel style={xshift={1em}},
yticklabel style={yshift={1em}},
]
\draw [line width=0.4pt] (0,0) -- (0:0.4) arc (0:60:0.4) -- cycle;
\draw [line width=0.4pt] (0,0) -- (0:0.35) arc (0:20:0.35) -- cycle;
\draw [line width=0.4pt] (0,0) circle (1);
\draw [line width=0.4pt,domain=0.0:2.027730435633692] plot(\x,{(-0.--0.8660254037844386*\x)/0.5});
\draw [line width=0.4pt,domain=0.0:2.027730435633692] plot(\x,{(-0.-0.*\x)/1.});
\draw [line width=0.4pt,domain=0.0:2.027730435633692] plot(\x,{(-0.--0.3420201433256687*\x)/0.9396926207859084});
\draw [fill=black] (0,0) circle (2.0pt);
\draw[color=black] (-0.10401667920577555,0.09712413496725324) node {$S$};
\draw[color=black] (-0.6287544305508752,0.958767374391877) node {$k$};
\draw [fill=black] (1,0) circle (2.5pt);
\draw[color=black] (0.85,-0.1264857022536699) node {$A$};
\draw [fill=black] (0.5,0.8660254037844386) circle (2.5pt);
\draw[color=black] (1.117013971395119,0.8872122264811816) node {$B[\cos{\alpha}; \sin{\alpha}]$};
\draw[color=black] (0.43,0.24) node {$\alpha$};
\draw [fill=black] (0.9396926207859084,0.3420201433256687) circle (2.5pt);
\draw[color=black] (1.522992684288592,0.2400490757514338) node {$C[\cos{\frac{\alpha}{3}}; \sin{\frac{\alpha}{3}}]$};
\draw[color=black] (0.5450723295090882,0.09639927698213733) node {$\frac{\alpha}{3}$};
\end{axis}
\end{tikzpicture}

\end{document}

  • I'm sorry I wasn't sure what \documentclass arguments should be used for just a standalone tikz picture. That's the reason this was posted as such. If you could help me with that I would gladly fix the issue... – Jakub Liška Mar 20 '20 at 08:57
  • Good job, I'm going to erase my comments here! Another way to add the code is to enclose it within \``latexand```` (both on separate lines just before and just after the code). Then the 4-space indentation is not needed, which I find very convenient (esp. when copying and pasting several times from your document to update a question or answer). – frougon Mar 20 '20 at 09:05

1 Answers1

1

Welcome to TeX.SE. All compilation problems I've found in your code come from the use of deprecated circle (〈r〉) syntax. Use circle[radius=〈r〉] instead and it works.

The x label is placed as you appear to desire. Another possibility would be to use xlabel style={anchor=north}. You can also combine both anchor and yshift for fine tuning, or use inner sep or inner ysep as in xlabel style={anchor=north, inner sep=1ex}.

For more details, see PGF issue 232 (also this and that).

\documentclass[tikz, border=2mm]{standalone}
\usepackage{pgfplots}
\pgfplotsset{compat=1.16}
\usetikzlibrary{arrows.meta}

\begin{document}

\begin{tikzpicture}
    \begin{axis}[
    x=2.5cm,
    y=2.5cm,
    axis x line=middle,
    axis y line=middle,
    every inner x axis line/.append style={-{Latex[scale=1.5]}},
    every inner y axis line/.append style={-{Latex[scale=1.5]}},
    xmin=-2,
    xmax=2,
    ymin=-1.5,
    ymax=1.5,
    xtick={-1,0,1},
    ytick={-1,0,1},
    xlabel={$x$},
    ylabel={$y$},
    xlabel style={yshift=-1.5em},
    xticklabel style={xshift={1em}},
    yticklabel style={yshift={1em}},
    ]
    \draw [line width=0.4pt] (0,0) -- (0:0.4) arc (0:60:0.4) -- cycle;
    \draw [line width=0.4pt] (0,0) -- (0:0.35) arc (0:20:0.35) -- cycle;
    \draw [line width=0.4pt] (0,0) circle[radius=2.5cm];
    \draw [line width=0.4pt,domain=0.0:2.027730435633692] plot(\x,{(-0.--0.8660254037844386*\x)/0.5});
    \draw [line width=0.4pt,domain=0.0:2.027730435633692] plot(\x,{(-0.-0.*\x)/1.});
    \draw [line width=0.4pt,domain=0.0:2.027730435633692] plot(\x,{(-0.--0.3420201433256687*\x)/0.9396926207859084});
    \draw [fill=black] (0,0) circle[radius=2.0pt];
    \draw[color=black] (-0.10401667920577555,0.09712413496725324) node {$S$};
    \draw[color=black] (-0.6287544305508752,0.958767374391877) node {$k$};
    \draw [fill=black] (1,0) circle[radius=2.5pt];
    \draw[color=black] (0.85,-0.1264857022536699) node {$A$};
    \draw [fill=black] (0.5,0.8660254037844386) circle[radius=2.5pt];
    \draw[color=black] (1.117013971395119,0.8872122264811816) node {$B[\cos{\alpha}; \sin{\alpha}]$};
    \draw[color=black] (0.43,0.24) node {$\alpha$};
    \draw [fill=black] (0.9396926207859084,0.3420201433256687) circle[radius=2.5pt];
    \draw[color=black] (1.522992684288592,0.2400490757514338) node {$C[\cos{\frac{\alpha}{3}}; \sin{\frac{\alpha}{3}}]$};
    \draw[color=black] (0.5450723295090882,0.09639927698213733) node {$\frac{\alpha}{3}$};
    \end{axis}
\end{tikzpicture}

\end{document}

enter image description here

frougon
  • 24,283
  • 1
  • 32
  • 55
  • I added some precisions regarding the label positioning. – frougon Mar 20 '20 at 08:49
  • I don't understand how this answer addresses the problem of a negative yshift value being rejected. – Frigo Nov 22 '22 at 14:27
  • @Frigo The xlabel style={yshift=-1.5em} in my code works quite fine. Presumably, the compilation errors made the OP believe that the negative yshift was causing trouble, while it actually wasn't. Compilation errors must always be eliminated before starting to fix problems in the resulting PDF. – frougon Dec 12 '22 at 20:58
  • 1
    I am having this negative yshift problem since I moved to a new machine with a fresher set of distribution packages. I found out, though, that I can work around it by prepending zero in front of the minus, e.g.: yshift=0-75pt. – Frigo Dec 13 '22 at 21:08
  • @Frigo I can confirm that this solves the problem also in bar shift. E.g., bar shift=-10pt => bar shift=0-10pt. Thanks! – Hitokage Jan 28 '23 at 09:13