I would like to draw frameworks around certain submatrices of a large matrix, like described in this question: Highlight elements in the matrix.
I tried some of the provided solutions and ended up using this one:
\documentclass{article}
\usepackage{amsmath}
\usepackage{tikz}
\usepackage{color}
\definecolor{orange}{RGB}{255,127,0}
\usetikzlibrary{arrows,matrix,positioning}
\usepackage{xfrac}
\begin{document}
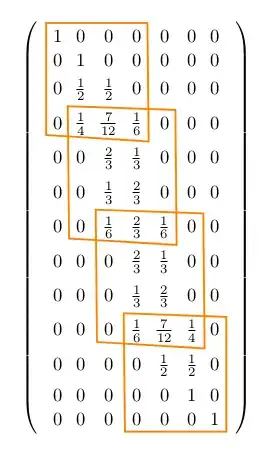
\begin{tikzpicture}
\matrix [matrix of math nodes,left delimiter=(,right delimiter=)] (m)
{
1 & 0 & 0 & 0 & 0 & 0 & 0\\
0 & 1 & 0 & 0 & 0 & 0 & 0\\
0 & \frac{1}{2} & \frac{1}{2} & 0 & 0 & 0 & 0\\
0 & \frac{1}{4} & \frac{7}{12} & \frac{1}{6} & 0 & 0 & 0\\
0 & 0 & \frac{2}{3} & \frac{1}{3} & 0 & 0 & 0\\
0 & 0 & \frac{1}{3} & \frac{2}{3} & 0 & 0 & 0\\
0 & 0 & \frac{1}{6} & \frac{2}{3} & \frac{1}{6} & 0 & 0\\
0 & 0 & 0 & \frac{2}{3} & \frac{1}{3} & 0 & 0\\
0 & 0 & 0 & \frac{1}{3} & \frac{2}{3} & 0 & 0\\
0 & 0 & 0 & \frac{1}{6} & \frac{7}{12} & \frac{1}{4} & 0\\
0 & 0 & 0 & 0 & \frac{1}{2} & \frac{1}{2} & 0\\
0 & 0 & 0 & 0 & 0 & 1 & 0\\
0 & 0 & 0 & 0 & 0 & 0 & 1\\
};
\draw[color=orange,line width=1pt] (m-1-1.north west) -- (m-1-4.north east) -- (m-4-4.south east) -- (m-4-1.south west) -- cycle;
\draw[color=orange,line width=1pt] (m-4-2.north west) -- (m-4-5.north east) -- (m-7-5.south east) -- (m-7-2.south west) -- cycle;
\draw[color=orange,line width=1pt] (m-7-3.north west) -- (m-7-6.north east) -- (m-10-6.south east) -- (m-10-3.south west) -- cycle;
\draw[color=orange,line width=1pt] (m-10-4.north west) -- (m-10-7.north east) -- (m-13-7.south east) -- (m-13-4.south west) -- cycle;
\end{tikzpicture}
\end{document}
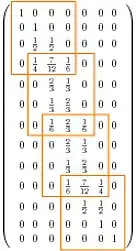
The thing is, when in a certain row there are both plain numbers and fractions, the frameworks are skewed like this:
How can I fix this? I tried to replace each \frac by \sfrac (that's why I added the package xfrac), but this makes the problem even worse.


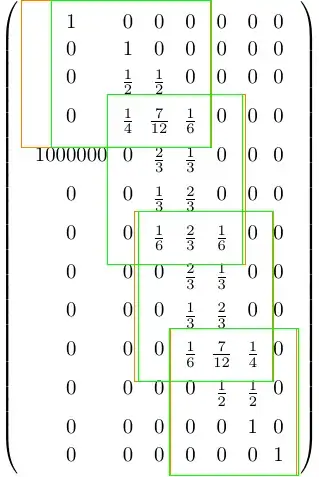
nodes={text depth=0.4ex, text height=1.6ex}to the matrix. This works fine for normal fractions, but doesn't solve the problem when using\sfrac(which wasn't very clearly indicated in my question, I know). – Ailurus May 01 '12 at 12:24