The authblk style does not seem to be made for this. It redefines the \maketitle command by locally redefining the tabular environment to become a center environment. One can exploit this to place the graphics. However, due to the authblk hacks, \endcenter gets executed twice so we need to take care of this, too.
\documentclass[10pt, twoside]{book}
\usepackage{authblk}
\usepackage{pgfplots}
\pgfplotsset{compat=1.17}%<- use a smaller version if you have an older installation
% Title, author and date
\title{\Huge \textbf{Title}}
\author{\textsc{John Doe}}
\affil{Department of Mathematics}
\date{2020}
\newsavebox\myplot
\sbox\myplot{\begin{tikzpicture}
\begin{axis}[trig format plots=rad,axis lines=left,
xtick=\empty,ytick=\empty,domain=0:4,xmin=-0.5,
xlabel=$n$,ylabel=$X_n$,
xlabel style={at={(ticklabel cs:1,0)}},
ylabel style={at={(ticklabel cs:1,0)},rotate=-90,anchor=west}]
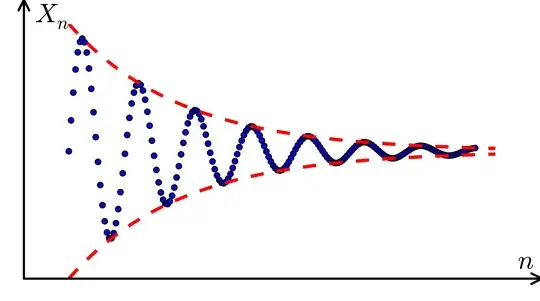
\addplot[smooth,red,dashed,very thick] {1+exp(-x)};
\addplot[smooth,red,dashed,very thick] {1-exp(-x)};
\addplot[only marks,mark=*,color=blue!70!black,samples=151] {1+exp(-x)*sin(10*x)};
\end{axis}
\path (current bounding box.north) + (0,1); % add some vertical space
\end{tikzpicture}}
\begin{document}
\begingroup
\let\oldendcenter\endcenter
\edef\mypftflag{0}%
\def\endcenter{%
\xdef\mypftflag{\the\numexpr\mypftflag+1}%
\ifnum\mypftflag>1\relax
\usebox\myplot
\fi
\oldendcenter}
\frontmatter % Turns on roman numbering
\maketitle
\endgroup
\section{pft}
\end{document}%

 (code here) below the title on the cover page.

authblkis not necessarily made for adding graphics at the title page. – Apr 29 '20 at 19:00