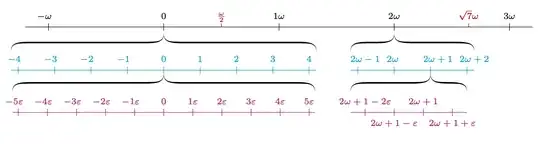
While the question leaves most of the efforts to the answerer it has IMHO an interesting aspect: draw asymmetric horizontal braces, i.e. the "tip" of the braces is not in the center. Maybe this has been done already with a decoration. However, there is an alternative: use this very nice answer to draw the braces via special arrow tips. This allows one to put the tip at any position (more or less, it cannot be too close to the ends of the brace). As for the question of arranging the smaller number lines, one can use a matrix.
\documentclass[tikz,border=3mm]{standalone}
\usepackage{mathtools}
\usetikzlibrary{arrows.meta,calc}
\pgfdeclarearrow{% https://tex.stackexchange.com/a/493083/194703
  name=Brace tip,
  parameters = {%
    \the\pgfarrowlength
    \the\pgfarrowlinewidth
  },
  setup code = {
    \pgfarrowssettipend{.5\pgfarrowlength}
    \pgfarrowssetlineend{-.45\pgfarrowlength}
    \pgfarrowssetvisualbackend{-.5\pgfarrowlength}
    \pgfarrowssetbackend{-.5\pgfarrowlength}
    \pgfarrowshullpoint{.5\pgfarrowlength}{.5\pgfarrowlength}
    \pgfarrowshullpoint{.5\pgfarrowlength}{-.5\pgflinewidth}
    \pgfarrowshullpoint{-.5\pgfarrowlength}{.5\pgflinewidth}
    \pgfarrowshullpoint{-.5\pgfarrowlength}{-.5\pgflinewidth}
    \pgfarrowssavethe\pgfarrowlength
  },
  drawing code = {
    \pgfpathmoveto{\pgfqpoint{-.5\pgfarrowlength}{.5\pgflinewidth}}%
    \pgfpathcurveto%
    {\pgfqpoint{.2\pgfarrowlength}{.5\pgflinewidth}}%
    {\pgfpoint{.5\pgfarrowlength-.25\pgflinewidth}{.05\pgfarrowlength}}%
    {\pgfpoint{.5\pgfarrowlength}{.5\pgfarrowlength}}%
    \pgfpathcurveto%
    {\pgfpoint{.5\pgfarrowlength+.25\pgflinewidth}{.05\pgfarrowlength}}%
    {\pgfqpoint{.2\pgfarrowlength}{-.5\pgflinewidth}}%
    {\pgfqpoint{-.5\pgfarrowlength}{-.5\pgflinewidth}}%
    \pgfpathlineto{\pgfqpoint{-.5\pgfarrowlength}{.5\pgflinewidth}}
    \pgfpathclose
    \pgfusepathqfill
  },
  defaults = {
    length = .5cm,
  }
}

\begin{document}
\begin{tikzpicture}[node font=\scriptsize,nodes={text depth=0.25ex,text height=0.6em}]
  % arrange the smaller number lines in a matrix.
  % Matrices work almost like magic but not quite so we have to add some
  % xshifts in the second column.
  \matrix[column sep=5mm] (mat){
   \draw[cyan] (-4.2,0) coordinate(L1) -- (4.2,0)  coordinate(R1)
      foreach \X in {-4,...,4}
   {(\X,-0.1)  coordinate (a\X)-- (\X,0.1) node[above]{$\ifnum\X<0\relax
   \mathllap{-}\the\numexpr-1*\X\relax\else\X\fi$}};
   &
   \draw[cyan,xshift=2cm] (-1.2,0) coordinate(L2) -- (2.2,0)coordinate(R2)
   foreach \X in {-1,...,2}
   {(\X,-0.1) coordinate (b\X) -- (\X,0.1) node[anchor=south west,
   xshift={-width("2")-width("$\omega$")/2-2pt}
   ]
   {$2\omega\ifnum\X<0 \X\else\ifnum\X>0+\X\fi\fi$}};
  \\[2em]
   \draw[magenta,xscale=0.8] (-5.2,0) coordinate(L3) -- (5.2,0)  coordinate(R3)
      foreach \X in {-5,...,5}
   {(\X,-0.1)  -- (\X,0.1) node[above]{$\ifnum\X<0\relax
   \mathllap{-}\the\numexpr-1*\X\relax\varepsilon\else\ifnum\X=0\relax0
   \else\X\varepsilon\fi\fi$}};
   &
   \draw[magenta,xscale=0.8,xshift=3.5cm] (-2.5,0) coordinate(L4) -- (1.5,0)coordinate(R4)
   foreach \X in {-2,...,1}
   {\ifodd\X
   (\X,0.1) -- (\X,-0.1) node[below]
   {$2\omega+1\ifcase\the\numexpr\X+2\relax
    -2\varepsilon
    \or
    -\varepsilon
    \or
    \or
    +\varepsilon
   \fi$}
   \else
   (\X,-0.1) -- (\X,0.1) node[above]
   {$2\omega+1\ifcase\the\numexpr\X+2\relax
    -2\varepsilon
    \or
    -\varepsilon
    \or
    \or
    +\varepsilon
   \fi$}
   \fi};
  \\
  };
  % some auxiliary coordinates
  \path (L1) -- (L3) coordinate[pos=0.3] (M1)
  (current bounding box.north west) coordinate
     (NW) (current bounding box.north east) coordinate (NE);
  % draw master number line by measuring the distance between the
  % two zero locations
  \draw let \p1=($(b0)-(a0)$) in
  [shift={([yshift=0.6cm]NW-|a0)},x={\x1/2}]
  (-1.2,0) --(3.2,0)
  foreach \X in {-1,...,3}
  {(\X,-0.1) coordinate (x\X)
      -- ++ (0,0.2) node[above]{$\ifnum\X<0\relax
  \mathllap{-}\omega\relax\else\ifnum\X=0\relax0\else\X\omega\fi\fi$}}
  (0.5,0.1) node[above,red]{$\frac{\omega}{2}$} edge[red] ++ (0,-0.1)
  ({sqrt(7)},0.1) node[above,red]{$\sqrt{7}\omega$} edge[red] ++ (0,-0.1)
  ;
  \path (x0) -- (L1) coordinate[pos=0.3] (M0);
  % braces using https://tex.stackexchange.com/a/493083/194703
  \draw[Brace tip-Brace tip,very thick] (L1|-M0) -- (x0|-M0);
  \draw[{Brace tip[swap]}-{Brace tip[swap]},very thick] (x0|-M0) -- (R1|-M0);
  \draw[Brace tip-Brace tip,very thick] (L2|-M0) -- (x2|-M0);
  \draw[{Brace tip[swap]}-{Brace tip[swap]},very thick] (x2|-M0) -- (R2|-M0);
  \draw[Brace tip-Brace tip,very thick] (L3|-M1) -- (a0|-M1);
  \draw[{Brace tip[swap]}-{Brace tip[swap]},very thick] (a0|-M1) -- (R3|-M1);
  \draw[Brace tip-Brace tip,very thick] (L4|-M1) -- (b1|-M1);
  \draw[{Brace tip[swap]}-{Brace tip[swap]},very thick] (b1|-M1) -- (R4|-M1);
\end{tikzpicture}
\end{document}