The positioning of the modules is hard-coded in the smartdiagram package, if your request is imperative, you must ask its maintainer to add this possibility to its package. You will find his email address in the manual.
Here is a version coded with the TikZ chain library. It is parameterized and allows you to display any regular polygons as for example with as many sides as you want. You can also choose where to position module 1 and the inner radius of the polygon.
p.s: Personally, I am not convinced that placing the module 1 to 12 hours is more aesthetic than what is natively done by the smartdiagram package.
Update: add internal dashed arrows
In this example, I called the whole polygon chain (polygon). The first node is called (polygon-1); the second node is called (polygon-2), and so on. This corresponds to the modules of smartdiagram.
To draw arrows, we use the classic TikZ code. And since it is a node (i.e. a box full of text), we can tell where the arrows should start and end by using the syntax (polygon-1.east) or (polygon-1.90). This is called an anchor.
The curvature of the arrows is determined by the parameter bend left=40, I put different curvatures (bend left=30 and bend left=10) so that you can see this curvature.
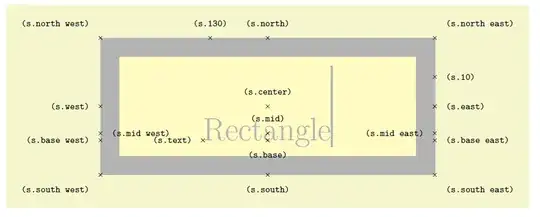
I quote the manual where the node is called (s), then you see (s.10); (s.east), etc.
Shape rectangle
This shape, which is the standard, is a rectangle around the text. The inner
and outer separations (see Section 17.2.3) influence the white space around the > text. The following figure shows the anchors this shape defines; the anchors 10 > and 130 are example of border anchors.
Translated with www.DeepL.com/Translator (free version)

\documentclass[tikz, margin=3mm]{standalone}
\usetikzlibrary {chains}
%\usetikzlibrary{arrows.meta}
\begin{document}
\def\nbcote{7}% number of side
\def\startmodule{90}% position of module 1
\def\rayon{6.5cm}%<- radius of polygon
\definecolor{teal}{RGB}{0,128,128}
\tikzset{every node/.style={on chain,text width=3.5cm,draw,rounded corners,minimum width=3.5cm,minimum height=2.8cm,top color=white,bottom color=teal!60
}}
\begin{tikzpicture}[start chain= polygon placed {at=({\startmodule+(\tikzchaincount-1)*(-360/\nbcote)}:\rayon)}]
\foreach \texte [count=\i from 1]in
  {Step 1: Define the Construct,Step 2: Determine Facets and Generate Narrative \mbox{Descriptions} for Each Facet,Step 3: Determine the Facet Levels and Generate Descriptions to Capture Variation within Each Facet, Step 4: \mbox{Determine} the Structure of the Scenarios,Step 5: \mbox{Developing} the Mapping \mbox{Sentences} and \mbox{Constructing} the Scenarios,Step 6: Decide on the Response Options and Survey Instructions, Step 7: Testing Congruence of \mbox{Theory} and Practice}
    {\node [] {\texte};
    }
%\draw (0,0) circle (\rayon);% <- circle inscribed in the polygon
\foreach \i [evaluate={
            \next=int(1+mod({\i},\nbcote));}]
        in {1,...,\nbcote}{
\draw[->,line width=2pt] (polygon-\i)tobend left=10;
}
\draw [->,line width=2pt,dashed] (polygon-7) to [bend left=10] (polygon-6);
\draw [->,line width=2pt,dashed] (polygon-6.east) to [bend left=30] (polygon-5.60);
\draw [->,line width=2pt,dashed] (polygon-5.40) to [bend left=40] (polygon-4.130);
\end{tikzpicture}
\end{document}
First answer:

\documentclass[tikz, margin=3mm]{standalone}
\usetikzlibrary {chains}
%\usetikzlibrary{arrows.meta}
\begin{document}
\def\nbcote{7}% number of side
\def\startmodule{90}% position of module 1
\def\rayon{6.5cm}%<- radius of polygon
\definecolor{teal}{RGB}{0,128,128}
\tikzset{every node/.style={on chain,text width=3.5cm,draw,rounded corners,minimum width=3.5cm,minimum height=2.8cm,top color=white,bottom color=teal!60
}}
\begin{tikzpicture}[start chain= polygon placed {at=({\startmodule+(\tikzchaincount-1)*(-360/\nbcote)}:\rayon)}]
\foreach \texte [count=\i from 1]in
  {Step 1: Define the Construct,Step 2: Determine Facets and Generate Narrative \mbox{Descriptions} for Each Facet,Step 3: Determine the Facet Levels and Generate Descriptions to Capture Variation within Each Facet, Step 4: \mbox{Determine} the Structure of the Scenarios,Step 5: \mbox{Developing} the Mapping \mbox{Sentences} and \mbox{Constructing} the Scenarios,Step 6: Decide on the Response Options and Survey Instructions, Step 7: Testing Congruence of \mbox{Theory} and Practice}
    {\node [] {\texte};
    }
%\draw (0,0) circle (\rayon);% <- circle inscribed in the polygon
\foreach \i [evaluate={
            \next=int(1+mod({\i},\nbcote));}]
        in {1,...,\nbcote}{
\draw[->,line width=2pt] (polygon-\i)tobend left=10;
}
\end{tikzpicture}
\end{document}
 I have this circular smartdiagram. I am asking for help to center one of the modules at the top and have the remaining three at each side. Here's what I have:


figureenvironment is incompatible with the standalone class. Removing thefigureenvironment will cause it to compile on MikTeX. – AndréC Aug 11 '20 at 04:55