I will offer a third way to solve the problem, more suited to real world scenarios.
I mostly work with medium-size numeric tables, maybe 40 to 60 rows, 15 to 25 columns, some with text only. Some data is entered manually with a strict “once-only” rule: only once the same data is allowed to be manually entered in the process.
Most of the time the tables were generated in a spreadsheet or imported to it from a statistical package or from the database.
Other columns are calculated, reordered, cells are highlighted to share a result with a collaborator, etc. Some columns will be internal consistency checks or comments that will never be made public.
Going to LaTeX to prepare a high-quality typesetting is the last step of a long work. Only a subset of the table will be published.
You would never dream of entering data directly into LaTeX code. Too error prone and a violation of the “once-only” rule.
The best alternative I found is the excel2latex plugin to excel.
https://ctan.org/tex-archive/support/excel2latex?lang=en
Once the final publication format is agreed with colleagues and bosses, it is very easy to obtain the (almost) final code.
All numeric and text data will be exported without errors. Sometimes you may need to add finishing touches such as aligning numeric data to the decimal dot, include another package, etc.
For example, to generate the example code, it took me 10 minutes to create the excel sheet and 15 seconds to export the code and include the package rotating.

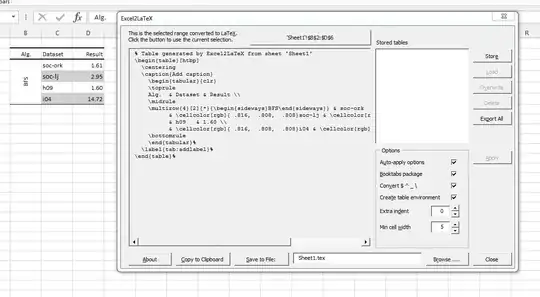
As you can see, the auto-generated code is somewhat different from the one proposed in the other answers, but it is very simple, easily editable, and the end result is nearly identical. (You can try with and without the booktab option).
\documentclass{article}
\usepackage[table]{xcolor}
\usepackage{booktabs,multirow}
\usepackage{rotating}
\begin{document}
% Table generated by Excel2LaTeX from sheet 'Sheet1'
\begin{table}[htbp]
    \centering
    \caption{Add caption}
    \begin{tabular}{clr}
        \toprule
        Alg.  & Dataset & Result \
        \midrule
        \multirow{4}[2]{*}{\begin{sideways}BFS\end{sideways}} & soc-ork  & 1.61 \
        & \cellcolor[rgb]{ .816,  .808,  .808}soc-lj & \cellcolor[rgb]{ .816,  .808,  .808}2.95 \
        & h09   & 1.60 \
        & \cellcolor[rgb]{ .816,  .808,  .808}i04 & \cellcolor[rgb]{ .816,  .808,  .808}14.72 \
        \bottomrule
    \end{tabular}%
    \label{tab:addlabel}%
\end{table}%
\end{document}

In the last report I participated in, looking at the printed draft, the project manager decided that a column should be sorted in ascending order rather than descending order.
It only took a few minutes to complete that task, rather than a day or more of entering all the data by hand in the LaTeX code and checking each figure at the output.
I explored several alternative tools. See
Comprehensive list of tools that simplify the generation of LaTeX tables
Some of them are online. A promising new one is https://www.latex-tables.com.
It can import excel files and other formats and can be useful in some cases.
For the moment I'll stick with excel2latex as the core of my tables workflow is done in excel.


