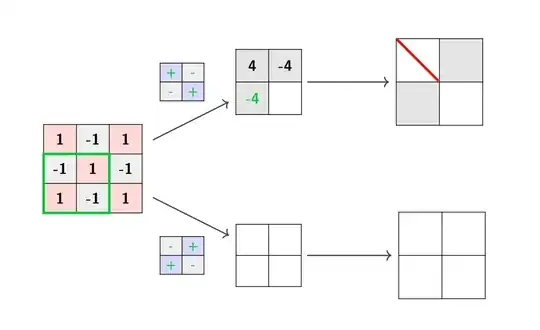
It is possible to reproduce the posted figure illustrating a convolutional neural network without \tikzset.
In fact, \tikzset won't help here much since each of the seven arrays is different.
I used nicematrix as a tabular environment because it works by creating Tikz\PGF nodes, so it fits perfectly with tikzpicture, producing a very compact code.
It is the only additional package required. (I commented on the other unused packages for this example)
% !TeX TS-program = pdflatex
\documentclass{article}
%\usepackage[utf8]{inputenc}
%\usepackage{tabularx}
%\usepackage{pifont}
%\usepackage{booktabs}
%\usepackage{caption}
%\usepackage{makecell}
%\usepackage{color}
%\usepackage{stackengine,amsmath}
%\stackMath
\usepackage[table]{xcolor}
\usepackage{tikz}
\usetikzlibrary{shapes.arrows}
%\usepackage[boxsize=1.25em, centerboxes]{ytableau}
%\usetikzlibrary{tikzmark,arrows.meta}
%\newcolumntype{M}{>{\centering\mbox{}\vfill\arraybackslash}m{50pt}<{\vfill}}
%\def\layersep{2.5cm}
\usepackage{nicematrix} % added
\begin{document}
\newcommand{\inputImg}{%
\begin{NiceTabular}{*{3}{>{\bfseries}c}}[cell-space-top-limit = 6pt,cell-space-bottom-limit = 6pt,
hvlines, code-before=\chessboardcolors{red!15}{gray!15}]
1 & -1 & 1 \
-1 & 1 & -1 \
1 & -1 & 1
\CodeAfter
\tikz \draw[green!80!blue, ultra thick] (row-2-|col-1) -- (row-2-|col-3)-- (row-4-|col-3)-- (row-4-|col-1)-- cycle;
\end{NiceTabular}
}
\newcommand{\filteri}{%
\begin{NiceTabular}{*{2}{>{\color{green!80!blue}\bfseries\footnotesize}wc{2pt}}}[cell-space-top-limit = 1pt,cell-space-bottom-limit = 1pt, hvlines, code-before=\chessboardcolors{blue!15}{gray!15}]
+ & - \
- & +
\end{NiceTabular}
}
\newcommand{\filterii}{%
\begin{NiceTabular}{*{2}{>{\color{green!80!blue}\bfseries\footnotesize}wc{2pt}}}[cell-space-top-limit = 1pt,cell-space-bottom-limit = 1pt, hvlines, code-before=\chessboardcolors{gray!15}{blue!15}]
- & + \
+ & -
\end{NiceTabular}
}
\newcommand{\firstlayeri}{%
\begin{NiceTabular}{*{2}{>{\bfseries}c}}[cell-space-top-limit = 7pt,cell-space-bottom-limit = 7pt,
hvlines, code-before=\cellcolor{gray!25}{1-1,1-2,2-1}]
4 & -4 \
\color{green!80!blue}-4 &
\end{NiceTabular}
}
\newcommand{\firstlayerii}{%
\begin{NiceTabular}{p{9pt} p{9pt}}[cell-space-top-limit = 4pt,cell-space-bottom-limit = 4pt,
hvlines]
& \
&
\end{NiceTabular}
}
\newcommand{\resulti}{%
\begin{NiceTabular}{p{16pt} p{16pt}}[cell-space-top-limit = 8pt,cell-space-bottom-limit = 8pt,
hvlines, code-before=\chessboardcolors{white}{gray!25}]
& \
&
\CodeAfter
\tikz{%
\draw[color=red, ultra thick] (row-1-|col-1) -- (row-2-|col-2);
}
\end{NiceTabular}
}
\newcommand{\resultii}{%
\begin{NiceTabular}{p{16pt} p{16pt}}[cell-space-top-limit = 8pt,cell-space-bottom-limit = 8pt,
hvlines]
& \
&
\end{NiceTabular}
}
\begin{tikzpicture}[shorten >=1pt,thick , draw=black!80]
\sffamily
\node(x0) at (0,0){\inputImg};
\node(x1) at (2,2){\filteri};
\node (x2) at (2,-2){\filterii};
\node (x3) at (4,2){\firstlayeri};
\node (x4) at (4,-2){\firstlayerii};
\node (x5) at (8,2){\resulti};
\node (x6) at (8,-2){\resultii};
\draw[->] (x0) -- (x3);
\draw[->] (x0) -- (x4);
\draw[->] (x3) -- (x5);
\draw[->] (x4) -- (x6);
\end{tikzpicture}
\end{document}
Going back to your code, and using the same technique, I replaced the output rectangle with an array (with its own internal nodes inside!). Only a single line was changed inside of the tikzpicture code.

\documentclass{article}
\usepackage[utf8]{inputenc}
\usepackage{tabularx}
\usepackage[table]{xcolor}
\usepackage{pifont}
\usepackage{booktabs}
\usepackage{caption}
\usepackage{makecell}
\usepackage{color}
\usepackage{stackengine,amsmath}
\stackMath
\usepackage{tikz-cd}
\usetikzlibrary{shapes.arrows}
\usepackage[boxsize=1.25em, centerboxes]{ytableau}
\usetikzlibrary{tikzmark,arrows.meta}
\newcolumntype{M}{>{\centering\mbox{}\vfill\arraybackslash}m{50pt}<{\vfill}}
\def\layersep{2.5cm}
\usepackage{nicematrix} % added
\begin{document}
\newcommand{\ouputImg}{% added <<<<
\begin{NiceTabular}{*{3}{>{\sffamily}c}}[cell-space-top-limit = 6pt,cell-space-bottom-limit = 6pt,
hvlines,code-before=\rectanglecolor{red!20}{1-1}{3-3}]
32 & 11 & 7 \
9 & 4 & 22 \
15 & 2 & 10
\end{NiceTabular}
}
\begin{tikzpicture}[shorten >=1pt,->,draw=black!50, node distance=\layersep]
\tikzstyle{every pin edge}=[<-,shorten <=1pt]
\tikzstyle{neuron}=[rectangle,fill=black!25,minimum size=17pt,inner sep=0pt]
\tikzstyle{input neuron}=[neuron, fill=blue!50];
\tikzstyle{output neuron}=[neuron, fill=red!50];
\tikzstyle{hidden neuron}=[neuron, fill=green!50];
\tikzstyle{annot} = [text width=4em, text centered]
\foreach \name / \y in {1,...,2}
\node[input neuron, pin=left: \y] (I-\name) at (0,-\y) {};
\foreach \name / \y in {1,...,3}
\path[yshift=0.5cm]
node[hidden neuron] (H-\name) at (\layersep,-\y cm) {};
\node[ right of=H-2] (O) {\ouputImg}; % <<<<<<<< changed
\foreach \source in {1,...,2}
\foreach \dest in {1,...,3}
\path (I-\source) edge (H-\dest);
\foreach \source in {1,...,3}
\path (H-\source) edge (O);
\end{tikzpicture}
\end{document}
See Should \tikzset or \tikzstyle be used to define TikZ styles?
about using of \tikzset or \tikzstyle


\usepackagestatements,\begin{document}/\end{document}etc., so that the output is reproducible without extra effort from potential answerers? Also it is not entirely clear to me what you want to output to look, maybe you can make a mock-up screenshot in a paint tool? – Marijn Feb 24 '21 at 11:30tikzstyleis deprecated nowadays. You may use onlytikzset. – SebGlav Feb 24 '21 at 11:35