17

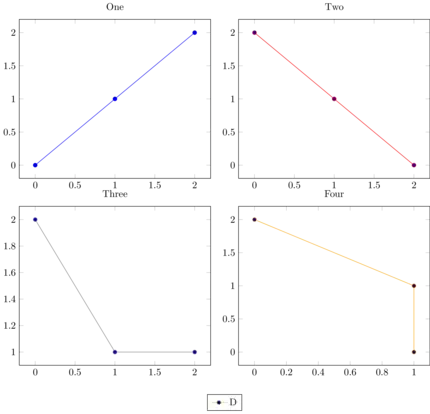
I would like to place a legend outside an axis using symbols from multiple plots within a groupplot. Trying it the way I show below doesn't seem to work, just the last entry is shown. How can this be done in a way such that all entries are shown?

\documentclass[crop]{standalone}

\usepackage[svgnames]{xcolor}
\usepackage{pgfplots}
\usepgfplotslibrary{groupplots}

\begin{document}

  \begin{tikzpicture}
    \begin{groupplot}[
      group style={
        {group size=2 by 2}},
      legend to name=grouplegend]

      \nextgroupplot[title=One]
      \addplot+[color=Blue] coordinates {(0,0) (1,1) (2,2)};
      \addlegendentry{A}

      \nextgroupplot[title=Two]
      \addplot+[color=Red] coordinates {(0,2) (1,1) (2,0)};
      \addlegendentry{B}

      \nextgroupplot[title=Three]
      \addplot+[color=Gray] coordinates {(0,2) (1,1) (2,1)};
      \addlegendentry{C}

      \nextgroupplot[title=Four]
      \addplot+[color=Orange] coordinates {(0,2) (1,1) (1,0)};
      \addlegendentry{D}

    \end{groupplot}

    \node (l1) at ($(group c1r2.south)!0.5!(group c2r2.south)$)
      [below, yshift=-2\pgfkeysvalueof{/pgfplots/every axis title shift}]
      {\ref{grouplegend}};

  \end{tikzpicture}

\end{document}

four plots in a 2x2 grid showing the legend with only the last entry

Stefan Pinnow
  • 29,535
sappjw
  • 1,013
  • I think you're best off posting a feature request for this on Sourceforge. PGFplots is being very actively developed, so there's a good chance of this being implemented relatively fast. – Jake Jun 19 '12 at 07:14

2 Answers2

10

You can use the /pgfplots/legend to name={<name>} feature described in the manual reference under "Legends outside of an axis". The example quoted is:

% Preamble: \pgfplotsset{width=7cm,compat=1.3}
\pgfplotsset{footnotesize,samples=10}
\begin{center}% note that \centering uses less vspace...
\begin{tikzpicture}
\begin{axis}[
legend columns=-1,
legend entries={$(x+0)^k$;,$(x+1)^k$;,$(x+2)^k$;,$(x+3)^k$},
legend to name=named,
title={$k=1$}]
\addplot {x};
\addplot {x+1};
\addplot {x+2};
\addplot {x+3};
\end{axis}
\end{tikzpicture}
%
\begin{tikzpicture}
\begin{axis}[title={$k=2$}]
\addplot {x^2};
\addplot {(x+1)^2};
\addplot {(x+2)^2};
\addplot {(x+3)^2};
\end{axis}
\end{tikzpicture}
%
\begin{tikzpicture}
\begin{axis}[title={$k=3$}]
\addplot {x^3};
\addplot {(x+1)^3};
\addplot {(x+2)^3};
\addplot {(x+3)^3};
\end{axis}
\end{tikzpicture}
\\
\ref{named}
\end{center}

Which produces:

one legend to rule them all

Edit: I guess this doesn't work for group plots. Here's a horrible hack that kinda works:

\documentclass[crop]{standalone}

\usepackage[svgnames]{xcolor}
\usepackage{pgfplots}
\usepgfplotslibrary{groupplots}

\begin{document}

  \begin{tikzpicture}
    \begin{groupplot}[
      group style={
        {group size=2 by 2}},
        xmin=0,
        enlarge x limits=true,
      ]

      \nextgroupplot[title=One, legend to name=grouplegend]
      \addplot+[color=Blue] coordinates {(0,0) (1,1) (2,2)};
      \addlegendentry{A}
      \addplot+[color=Red] coordinates {(-1,0)};
      \addlegendentry{B}
      \addplot+[color=Gray] coordinates {(-1,0)};
      \addlegendentry{C}
      \addplot+[color=Orange] coordinates {(-1,0)};
      \addlegendentry{D}

      \nextgroupplot[title=Two]
      \addplot+[color=Red] coordinates {(0,2) (1,1) (2,0)};

      \nextgroupplot[title=Three]
      \addplot+[color=Gray] coordinates {(0,2) (1,1) (2,1)};

      \nextgroupplot[title=Four]
      \addplot+[color=Orange] coordinates {(0,2) (1,1) (1,0)};

    \end{groupplot}

    \node (l1) at ($(group c1r2.south)!0.5!(group c2r2.south)$)
      [below, yshift=-2\pgfkeysvalueof{/pgfplots/every axis title shift}]
      {\ref{grouplegend}};

  \end{tikzpicture}

\end{document}

This produces:

yay for hacks

David Carlisle
  • 757,742
slurms
  • 551
  • If I understand the question correctly, this won't work for this case: You can't "collect" plots from different axes using this method. In the question, each axis contains one plot, but the legend should contain four entries (blue, red, gray and orange). – Jake Jun 15 '12 at 17:23
  • Ah, I see, d'oh. I've edited the answer with an idea to rectify the situation. – slurms Jun 15 '12 at 18:02
  • @Jake is correct. I will look at the edit to see if it works. – sappjw Jun 18 '12 at 13:34
  • FYI, I've just given the original answer a go and it does work now. I define legend to name=named in the group style=[]. After I \end{groupplot} \end{tikpicture}, I leave \ref{named} (before the \caption{}) and it aligns correctly. – Matthew Oct 21 '19 at 16:03
3

In case someone else comes across this, in the current version of pgfplots (1.15) and using groupplot, slurms' & Carlisle's answer does indeed work. An example within a figure (edit: now including the document preamble and wrapper for compiling):

\documentclass{article}
\usepackage[margin=0.5in]{geometry}
\usepackage[utf8]{inputenc}

\usepackage{tikz} % To generate the plot from csv
\usepackage{pgfplots,pgfplotstable}
\usepgfplotslibrary{groupplots}

% Standard presentation for graphs
\pgfplotsset{compat=1.15} % Allows to place the legend below plot


\begin{document}

\begin{figure}[h!]
  \begin{center}


    \begin{tikzpicture}
    \begin{groupplot}[group style={
            group size=2 by 2,
            xticklabels at=edge bottom,
            yticklabels at=edge left
        }, 
        height=0.4\textwidth,
        width=0.5\textwidth,
        xmin=-5, xmax=55,
        ymin=70, ymax=105,
        xtick={0,10,30,50},
        ytick={70,80,90,100},
        ymajorgrids=true,
        grid style=dashed,
        legend to name=named,
        legend columns=-1
    ]

    \nextgroupplot
    \addplot coordinates {(0,98.65)(10,97.34)(30,91.23)(50,87.55)};
    \addplot coordinates {(0,98.15)(10,96.34)(30,90.23)(50,83.55)};

    \nextgroupplot
    \addplot coordinates {(0,98.65)(10,97.34)(30,91.23)(50,87.55)};
    \addplot coordinates {(0,98.15)(10,96.34)(30,90.23)(50,83.55)};    

    \nextgroupplot
    \addplot coordinates {(0,98.65)(10,97.34)(30,91.23)(50,87.55)};
    \addplot coordinates {(0,98.15)(10,96.34)(30,90.23)(50,83.55)};    

    \nextgroupplot
    \addplot coordinates {(0,98.65)(10,97.34)(30,91.23)(50,87.55)};
    \addplot coordinates {(0,98.15)(10,96.34)(30,90.23)(50,83.55)};


    \legend{Line 1, Line 2}

    \end{groupplot}
    \end{tikzpicture}

    \ref{named}

    \caption{My first groupplot plot.}


  \end{center}
\end{figure}

\end{document}

Provides the following in-document:

enter image description here

Matthew
  • 141