I have two approaches. The first based on the use of pgf-pie, as used by the OP, and the second, based on a different approach.
APPROACH 1
Here, I draw three concentric pie-charts to achieve the result.
The concentric approach is that the first pie chart draws the legend and places the slice values on the chart (which is bad for thin slices). The second concentric chart only replots those slices through those that are too thin, and asks the the numbering be omitted inside the slice, and instead I use the outer text region at the periphery to reiterate the slice value (I also had to \raisebox). The last plot replots the 13.52% slice, which can have the label inside.
\documentclass{article}
\usepackage{pgf-pie}
\begin{document}
\begin{figure}[h!]
\centering
\begin{tikzpicture}
\small
\pie[radius=2, color={cyan!90, green!70, blue!40, magenta!90},text=legend]{13.52/Opernveranstaltungen, 1.19/Operettenveranstaltungen, 3.58/Musicalveranstaltungen, 81.7/andere Veranstaltungen}
\pie[hide number, radius=2, color={cyan!90, green!70, blue!40}]%
  {13.52/, 1.19/\!1.19\%, 3.58/\raisebox{3pt}{$\!\!3.58\%$}}
\pie[radius=2, color={cyan!90, green!70, blue!40}]{13.52/}
\end{tikzpicture}
\caption[Veranstaltungen]{Veranstaltungen}
\label{fig:verteilung_theatertypen}
\end{figure}
\end{document}

APPROACH 2
I just tried to adapt my answer from Pie graph with outside text. Here, I check the percentage value...if it is less than 3, the label goes on the outside. I provide a parameter to shift the label to prevent overlap, and also provide a color specification.
\documentclass{article}
\newcounter{a}
\newcounter{b}
\usepackage{tikz}
\begin{document}
\def\trunc#1.#2\relax{#1}
\newcommand{\slice}[6]{
\pgfmathparse{0.5*#2+0.5*#3}
\let\midangle\pgfmathresult
% slice
\draw[thick,fill=#1] (0,0) -- (#2:1) arc (#2:#3:1) -- cycle;
% outer label
\node[label=\midangle:#5] at (\midangle:1#6) {};
% inner label
\pgfmathparse{min((#3-#2-10)/110*(-0.3),0)}
\let\temp\pgfmathresult
\pgfmathparse{max(\temp,-0.5) + 0.8}
\let\innerpos\pgfmathresult
\node at (\midangle:\innerpos) {#4};
}
\begin{figure} [!htbp]
\begin{center}
\begin{tikzpicture}[scale=3]
\newcounter{c}
\newcounter{d}
\foreach \p/\d/\cc in {
13.52//cyan!90,
1.19/-.04/green!70,
3.58/.03/blue!40, % PCT/OUTER LABEL DECIMAL SHIFT/COLOR
81.7//magenta!90}
{
\setcounter{a}{\theb}
\pgfmathparse{int(100*\p)}
\addtocounter{b}{\pgfmathresult}
\slice{\cc}{\thea/10000*360}
{\theb/10000*360}
{\ifnum\expandafter\trunc\p\relax>3\relax\p\%\fi}% <- CUTOFF OF 3%
{\ifnum\expandafter\trunc\p\relax>3\relax\else\p\%\fi}
{\d}
}
\end{tikzpicture}
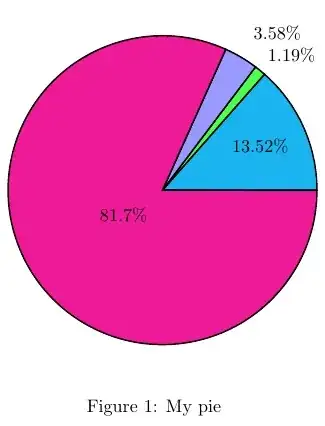
\end{center}
\caption{My pie}
\end{figure}
\end{document}