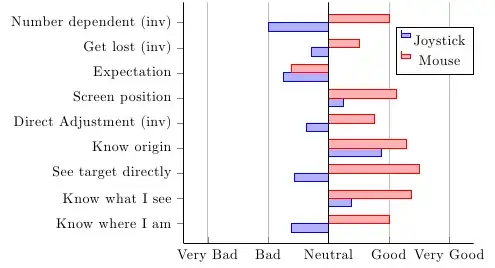
I have finally managed to center my data with axis x line*=center, but I haven't found a way to get my x tick labels at the bottom of the figure. I have already drawn some major grid lines and now I want my tick labels to be at the bottom of my figure.
I have tried to use at={()}, but that did not seem to work.

\documentclass{standalone}
\usepackage{pgfplots}

\begin{document}
\begin{tikzpicture}
    \pgfplotstableread{data/multicontrol.dat}\datatable

    \begin{axis}[ybar=0,
    bar width={0.2cm},
    xticklabels from table={\datatable}{variable},
    xtick=data,
    x tick label style={
        rotate=60,anchor=east},
    yticklabels={X,Very Bad, Bad, Neutral, Good, Very Good},
    xmajorgrids,
    ymin=-2,
    ymax=2,
    axis x line*=middle,
    axis y line*=left,
    enlarge x limits,
    y filter/.code={\pgfmathparse{#1-3}}
    ]

    \addplot table[x=X,y=old] {\datatable};
    \addlegendentry{Joystick}
    \addplot table[x=X,y=new] {\datatable};
    \addlegendentry{Mouse}
    \end{axis}
\end{tikzpicture}
\end{document}
Example data:
X   variable                    old         new
1   {Know where I am}           2.375       4
2   {Know what I see}           3.375       4.375
3   {See target directly}       2.428571429 4.5
4   {Know origin}               3.875       4.285714286
5   {Direct Adjustment (inv)}   2.625       3.75
6   {Screen position}           3.25        4.125
7   {Expectation}               2.25        2.375
8   {Get lost (inv)}            2.714285714 3.5
9   {Number dependent (inv)}    2           4

yticklabels={X,Very Bad, Bad, Neutral, Good, Very Good}. It seems a little hacky with theXin front, but that was the only way to get it working somehow. – Marnix Jun 16 '12 at 15:37ytick={-2,...,2}, yticklabels={Very Bad, Bad, Neutral, Good, Very Good}– Jake Jun 16 '12 at 15:40