I want to redraw the following graphic in pgf/TikZ.

I struggle to draw the rotated paraboloid/the root function. I come this far:
\documentclass{minimal}
\usepackage{tikz}
\begin{document}
\begin{center}
\begin{tikzpicture}[scale=1,cap=round]
    \tikzstyle{axes}=[]
    \tikzstyle{important line}=[very thick]
    \colorlet{setcolor}{green!50!black}

    % help lines
    \draw[style=help lines,step=1cm] (-4.4,-4.4) grid (4.4,4.4);

    \draw (4.4,2) parabola bend(-1,0) (4.4,-2);

    \begin{scope}[style=axes]
        \draw[->] (-4.5,0) -- (4.5,0) node[right] {$x$};
        \draw[->] (0,-4.5) -- (0,4.5);
        \draw[xshift=1 cm] (0pt,1pt) -- (0pt,-1pt) node[below,fill=white] {$1$};
        \draw[yshift=1 cm] (1pt,0pt) -- (-1pt,0pt) node[left,fill=white] {$1$};
    \end{scope}

\end{tikzpicture}
\end{center}
\end{document}

I searched the documentation of pgf/TikZ, but am unable to find a solution.
Incorporating the solution of percusse, it is unfortunately being rendered as follows for me:
I am still looking into this. Maybe I need a newer version of pgf/TikZ or pgfplots.
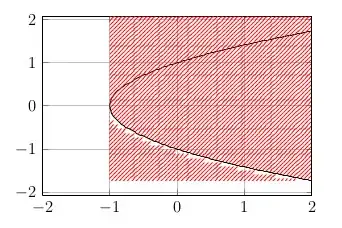
Building on the solution of percusse, I just used a different filling method and got it working.
\documentclass{article}
\usepackage{pgfplots}
\usetikzlibrary{patterns}

\begin{document}
\begin{center}
  \begin{tikzpicture}
    \begin{axis}[no markers,domain=-1:2,samples=500,xmin=-2,xmax=2,y post scale=0.8,grid=major]
      \addplot[black] {sqrt(x+1)};
      \addplot[black,fill=green!20!white,opacity=.6] {-sqrt(x+1)} |- (axis cs:-1,3);
    \end{axis}
  \end{tikzpicture}
\end{center}
\end{document}

Thank you!


\draw[rotate=-90] (-2,4.4) parabola bend(0,-1) (2,4.4);– mrf Jun 27 '12 at 20:43\listfilesin your preamble, and search the log file for the version. For comparison, my version ofpgfplotsispgfplots.sty v1.5.1. – Alenanno Jun 28 '12 at 09:06