Always set compat level - see code.
You have the same problem as here:pgfplots surface plot from table
-your data is formatted wrong(a single line)
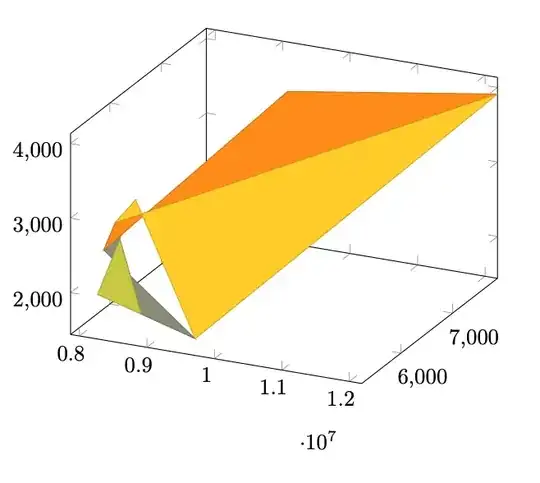
Inserting a blank line triggers surf to treat it as a surface anyway, although probably not what you want:
\documentclass[tikz, border=1cm]{standalone}
\usepackage{pgfplots}
\pgfplotsset{compat=1.18}
\begin{document}
  \begin{tikzpicture}
    \begin{axis}{unbounded coords=jump, view={70}{40}, colormap/viridis, scale only axis, scaled ticks=false}
      \addplot3[surf]
coordinates{
(9715658,5237.548,1662.979)
(8905129.8213686,5248.96044843318,1863.6983325056)
(8061017,5509.97,1858.004)
(7917754.57021608,5816.5781775536,2267.9700413312)
(7868445.94326526,6104.8328939749,2472.8959922048)
(8149171,6132.452,2808.096)
(9375859,7471.631,3732.035)
(12183200,7869.911,3911.075)
(9715658,5237.548,1662.979)
};
\end{axis}
\end{tikzpicture}
\end{document}
Edit:
Just to be clear - there is no way to know what you want with your wrongly formatted data. The points are not coplanar, and do not make up a surface by themselves. That been said, one can guess that you somehow want a spanning surface and maybe do not care about how it is formed!?. There is a multitude of ways to do this - here is one example with interpolated points:
\documentclass[tikz, border=1cm]{standalone}
\usepackage{pgfplots}
\pgfplotsset{compat=1.18}
\begin{document}
  \begin{tikzpicture}
    \begin{axis}{unbounded coords=jump, view={70}{40}, colormap/viridis, scale only axis, scaled ticks=false}
\addplot3[surf, mark=*]
coordinates{
(9715658,5237.548,1662.979)
(8905129.8213686,5248.96044843318,1863.6983325056)
(8061017,5509.97,1858.004)
(7917754.57021608,5816.5781775536,2267.9700413312)
(7868445.94326526,6104.8328939749,2472.8959922048)
(8149171,6132.452,2808.096)
(9375859,7471.631,3732.035)
(12183200,7869.911,3911.075)
(9715658,5237.548,1662.979)
(10000000,5540.93,1922.03)
(10200000,5754.29,2104.24)
(10500000,6074.33,2377.56)
(11000000,6607.73,2833.1)
(11500000,7141.13,3288.63)
(12000000,7674.53,3744.16)
(12183200,7869.911,3911.075)
};
\end{axis}
\end{tikzpicture}
\end{document}


