I am in need of displaying line graphs in a LaTeX document but I can't figure out how. I searched on Google but did not receive any promising results. Is it really possible to do this within LaTeX or will I have to embed a jpeg image of a line graph created in Excel?
Asked
Active
Viewed 1.6k times
8
2 Answers
8
Well pgfplots definitely:
\documentclass[border=5mm]{standalone}
\usepackage{pgfplots}
\begin{document}

\begin{tikzpicture}
    \begin{axis}[domain=-2*pi:2*pi]
    \addplot[mark=none, samples=100, red] function {sin(x)};
    \end{axis}
\end{tikzpicture}

\end{document}

Its simple, clean and will produce high quality plots, which fit perfectly into the document style.
For more complex plots you may use gnuplot for computation.
pgfplots can include table files as well (data stored in columns such tables gnuplot prints).
bloodworks
- 10,178
0
I suggest you better create your plots by another application similar e.g. Octave in order to create graphs like:
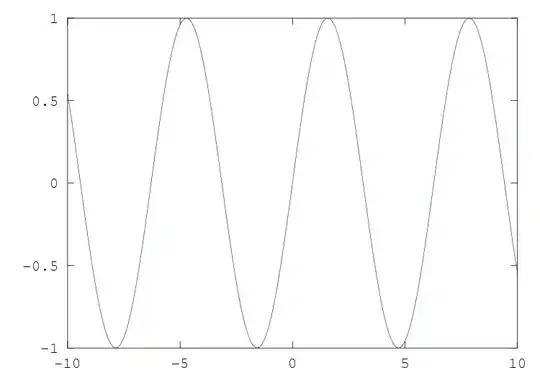
See e.g. here for further reference. In my opinion LaTeX is only suitable to create very basic graphs that are not likely to be changed often. Otherwise I'd always recommand to use plotting tools and export the graphics as vector images and include them to your LaTeX file.
Eric
- 2,587
- 5
- 23
- 26
-
3I would absolutely disagree with this and recommend that one use other tools if you have only one or two basic graphs to do. If you have a lot of them, and are not straightforward you should use
pgfplots. It is quite an awesome package. – Peter Grill Jul 06 '12 at 06:43 -
2I agree with Peter's comment. I used to create all my plots using external programs and then included them in the LaTeX file afterwards, but after switching to
pgfplots, I find that approach vastly less comfortable and much harder to maintain. Also, it's near impossible to create plots that really match the document style using external tools. I'd like to see an example for a plot that couldn't be created directly within LaTeX. – Jake Jul 06 '12 at 06:57 -
2In addition to Peter's and Jake's comment, I would like to say something on a different aspect. For my thesis I have to perform a lot of simulations and
pgfplotsis really saving my time in creating reports; I can make a graphic almost in real time simply starting from.datfile. That's besides the quality aspect.. for these two reasonspgfplotsis the right tool to make graphs in LaTeX IMHO. – Claudio Fiandrino Jul 06 '12 at 08:21 -
2@Peter and @Jake: actually after doing some research as far as the
pgfplotspackage is concerned, I'm reconsidering my answer (and even my normal approach to this). The package appears to be very useful and I'm trying to create my next visualisations with it - and perhaps I'm switching for good... Thank you for the hint! – Eric Jul 06 '12 at 08:41
pgfplotsto draw graphs. – Peter Grill Jul 06 '12 at 05:00pgfplotsdocumentation shows how this can be done. There's also thepstricks2D plot and 3D plot gallery. – Werner Jul 06 '12 at 05:31