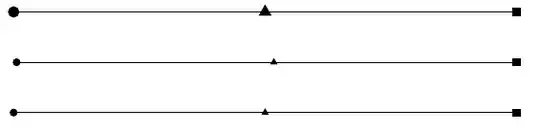
Three solutions: the first one, using the basic shapes circle and rectangle, and the regular polygon shape from the shapes library (as in Peter Grill's comment). The second and third ones use the plotmarks library; in the second one, the line and the marks are drawn independently (the marks are placed using \nodes with \pgfuseplotmark); in the third solution, the plot coordinates syntax is used, together with the mark=<mark> option (as in Christian Feuersänger's comment):
\documentclass{article}
\usepackage{tikz}
\usetikzlibrary{shapes}
\usetikzlibrary{plotmarks}

\begin{document}

\begin{tikzpicture}
\draw (0,0)--(10,0);
\filldraw (0,0) circle (3pt);
\filldraw ([xshift=-2pt,yshift=-2pt]10,0) rectangle ++(4pt,4pt);
\node[fill=black,regular polygon, regular polygon sides=3,inner sep=1.5pt] at (5cm,0) {};

\draw (0,-1)--(10,-1);
\node at (0,-1) {\pgfuseplotmark{*}};
\node at (5cm,-1) {\pgfuseplotmark{triangle*}};
\node at (10cm,-1) {\pgfuseplotmark{square*}};

\draw[mark=*] plot coordinates {(0,-2)} -- plot[mark=triangle*] coordinates {(5cm,-2)} --
  plot[mark=square*] coordinates {(10cm,-2)};
\end{tikzpicture}

\end{document}
The following code shows how to change the size and color of the marks for the second and third solutions:
\documentclass{article}
\usepackage{tikz}
\usetikzlibrary{plotmarks}

\begin{document}

\begin{tikzpicture}
\draw (0,-1)--(10,-1);
\node[mark size=3pt,color=red] at (0,-1) {\pgfuseplotmark{*}};
\node[mark size=5pt,color=blue] at (5cm,-1) {\pgfuseplotmark{triangle*}};
\node[mark size=4pt,color=olive] at (10cm,-1) {\pgfuseplotmark{square*}};

\draw[mark=*,mark size=3pt,mark options={color=olive}] plot coordinates {(0,-2)}
  -- plot[mark=triangle*,mark options={color=blue}] coordinates {(5cm,-2)}
  -- plot[mark=square*,mark size=4pt,mark options={color=red}] coordinates {(10cm,-2)};
\end{tikzpicture}

\end{document}

\filldraw (10,0) rectangle ++(3pt,3pt);. Adding[yshift=-1.5pt]will center it vertically as the circle is. – Peter Grill Jul 24 '12 at 20:22