Starting with version 1.6 of PGFPlots (I think), a new key output empty row has become available that suppresses printing of a row. This can be used in your style:

\documentclass{article}
\usepackage{pgfplotstable}
\usepackage{booktabs}
\begin{document}
\pgfplotstabletypeset[
col sep=&, header=false,
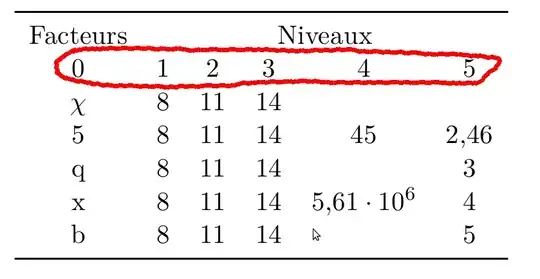
every head row/.style={
output empty row,
before row={%
\toprule
Facteurs & \multicolumn{5}{c}{Niveaux}\\
}
},
every last row/.style={
after row=\bottomrule
},
display columns/0/.style={string type}
]
{%
\pgfutilensuremath{\chi} & 8 & 11 & 14 & &
5 & 8 & 11 & 14 & 45 & 2.456
q & 8 & 11 & 14 & & 3
x & 8 & 11 & 14 & 5612345 & 4
b & 8 & 11 & 14 & & 5
}
\end{document}
If you're using an earlier version and can't / don't want to update, here's a slightly brutish workaround. You can add the code
\makeatletter
\pgfplotsset{
    /pgfplots/table/omit header/.style={%
        /pgfplots/table/typeset cell/.append code={%
            \ifnum\c@pgfplotstable@rowindex=-1
                \pgfkeyslet{/pgfplots/table/@cell content}\pgfutil@empty%
            \fi
        }
    }
}
\makeatother
in your preamble, which makes a style omit header row available. If you use that key in \pgfplotstable, the output routine for each table cell will be amended with a check whether we're in row number -1 (the header row), and if we are, no output is generated.
\documentclass{article}
\usepackage{pgfplotstable}
\usepackage{booktabs}


\makeatletter
\pgfplotsset{
    /pgfplots/table/omit header/.style={%
        /pgfplots/table/typeset cell/.append code={%
            \ifnum\c@pgfplotstable@rowindex=-1
                \pgfkeyslet{/pgfplots/table/@cell content}\pgfutil@empty%
            \fi
        }
    }
}
\makeatother

\begin{document}
\pgfplotstabletypeset[
    col sep=&,
    header=false,
    every head row/.style={
        before row={%
            \toprule
            Facteurs & \multicolumn{5}{c}{Niveaux}\\
        }
    },
    every last row/.style={
        after row=\bottomrule
    },
    display columns/0/.style={string type},
    omit header
]
{%
\pgfutilensuremath{\chi} & 8 & 11 & 14 & &
5 & 8 & 11 & 14 & 45 & 2.456
q & 8 & 11 & 14 & & 3
x & 8 & 11 & 14 & 5612345 & 4
b & 8 & 11 & 14 & & 5
}
\end{document}