I am working on Graph Theory and I have to draw paths that seem quite random such as the ones on the 1st image. I have created the paths P,Q on the 2nd image using the code below.

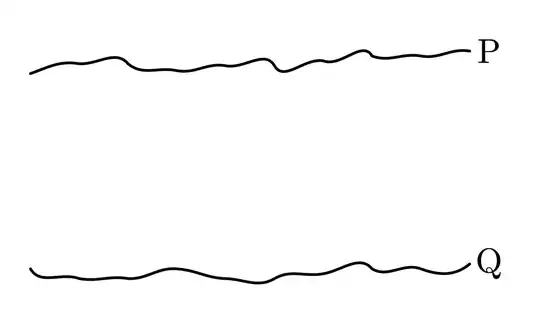
However, it seems really frustrating having to add more points to achieve more definition and having to change "ins" and "outs" of paths to "generate randomness".
What I'm really asking for is a more practical way to generate paths such as P,Q, that could then, of course, be impelemnted to produce something like the graph on the 1st image.
\documentclass[border=10pt]{standalone}
\usepackage{pgfplots}
\usetikzlibrary{calc}
\begin{document}
\begin{tikzpicture}[line cap=round]
%  Path P
\draw[thick]
    (-5,2) to[out=20, in=170] ++(0.5,0.1)
           to[out=-2, in=130] ++(0.5,+0)
           to[out=-40, in=168] ++(0.5,-0.07)

           to[out=-10, in=170] ++(0.5,+0.05)

           to[out=-10, in=120] ++(0.5,0)
           to[out=300, in=170] ++(0.5,+0.05)

           to[out=-20, in=120] ++(0.5,+0.05) coordinate (u)

           to[out=-20, in=170] ++(0.5,0)
           to[out=-10, in=170] ++(0.5,+0.05) coordinate (P)

    ;
\node[shift={(0.2,0)}] at (P) {$\mathrm{P}$};

% Path Q
\draw[thick]
    (-5,0) to[out=300, in=160] ++(0.5,-0.1)
           to[out=-10, in=170] ++(0.5,0)

           to[out=-2, in=175] ++(0.5,+0.1) coordinate (y)
           to[out=-4, in=178] ++(0.5,-0.1)
           to[out=-2, in=210] ++(0.5,+0)
           to[out=30, in=190] ++(0.5,0.05) coordinate (v)
           to[out=+10, in=130] ++(0.5,+0.05)

           to[out=-30, in=160] ++(0.5,0)
           to[out=-20, in=220] ++(0.5,+0.05) coordinate (Q)
    ;
    \node[shift={(0.2,0)}] at (Q) {$\mathrm{Q}$};
\end{tikzpicture}
\end{document}
