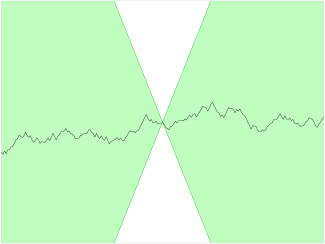
Anyone knows how to elegantly improve the following wikipedia (wikimedia) image quality from a Lipschitz continuity function to make it vectorial in Tikz or Pgfplots?
Visible here below:

Thanks for your contribution!
Anyone knows how to elegantly improve the following wikipedia (wikimedia) image quality from a Lipschitz continuity function to make it vectorial in Tikz or Pgfplots?
Visible here below:
Thanks for your contribution!
Because it's pretty challenging to imitate the function shown in your image exactly, I've created something else that may help you to accomplish the same goal—here's a little script that creates an arbitrary Lipschitz-continuous function from a random number generator.
You can customize what the output looks like by tinkering around with these three parameters:
\numSamples - the number of random samples used to create the function. More samples result in a more jagged-looking function.\K - the Lipschitz constant of the function\pgfmathsetseed - sets the seed of Tikz's random number generator
\documentclass[12pt]{article}
\usepackage[svgnames]{xcolor}
\usepackage{pgfplots}
\usepgfplotslibrary{fillbetween}
\usetikzlibrary{math}
\begin{document}
\def\numSamples{50}
\def\K{1}
\pgfmathsetseed{123456789}
\def\lipschitzFunc{(0,0)}
\tikzmath{
  \funcValue = 0; % the graph begins at the origin
  for \n in {1,...,\numSamples} {
    if \n <= \numSamples / 2 then { % first, generate the right side of the graph
      \deltaX = 4 / int(\numSamples / 2);
      \funcValue = \funcValue + rand * \K * \deltaX;
      \xVal = \n * \deltaX;
      {\global\edef\lipschitzFunc{\lipschitzFunc(\xVal,\funcValue)}};
    }
    else { % then, come back and generate the left side of the graph
      if \n == 1 + int(\numSamples / 2) then {
        \funcValue = 0;
      };
      \deltaX = 4 / int((\numSamples + 1)/ 2);
      \funcValue = \funcValue + rand * \K * \deltaX;
      \xVal = (int(\numSamples / 2) - \n) * \deltaX;
      {\global\edef\lipschitzFunc{(\xVal,\funcValue)\lipschitzFunc}};
    };
  };
}
\begin{tikzpicture}
\begin{axis}[
  xmin  = -4,
  xmax  =  4,
  ymin  = -4,
  ymax  =  4,
  xtick = \empty,
  ytick = \empty,
  axis on top,
  %axis line style={draw=none} % uncomment this line to remove surrounding box
]
\addplot[smooth] coordinates {\lipschitzFunc};
\addplot[name path = downup, color = LimeGreen, very thick]{ \K * x};
\addplot[name path = updown, color = LimeGreen, very thick]{-\K * x};
\addplot[fill = PaleGreen]
  fill between
  [
    of = updown and downup,
    soft clip = {domain = 0:4}
  ];
\addplot[fill = PaleGreen]
  fill between
  [
    of = downup and updown,
    soft clip = {domain = -4:0}
  ];
\end{axis}
\end{tikzpicture}
\end{document}