-1

In PowerPoint, there are often nice three key point diagrams like

First example (source: https://www.slideteam.net/performance-mapping-ppt-powerpoint-presentation-portfolio-graphics-pictures-cpb.html)

or

Second example (source: https://www.slidegeeks.com/business/product/three-levels-relationship-marketing-examples-ppt-powerpoint-presentation-ideas-display)

My question is, how do I best generate such diagrams in LaTeX for usage in beamer?

I assume this will likely involve TikZ? Ideally, some guidance, if possible even a MWE could be given to create a similar nice diagram. That way, also LaTeX users can make use of such styles.

  • One central node on the left, like in the first example
  • Three (or even better, a flexible amount) of child nodes arranged around the central node (to the right of it)
  • Text entries next to child nodes like in the second example
  • Color style like in the second example
clel
  • 325
  • Have a look at https://www.ctan.org/pkg/smartdiagram – samcarter_is_at_topanswers.xyz Jun 27 '23 at 15:00
  • Duplicates: https://tex.stackexchange.com/questions/642066/i-want-this-infographics-as-animated-tikz-in-beamer https://tex.stackexchange.com/questions/423859/drawing-diagrams-in-latex-with-tikz https://tex.stackexchange.com/questions/344586/how-do-i-make-these-two-diagrams-in-beamer/344599 https://tex.stackexchange.com/questions/366652/diagram-with-latex-smart-art https://tex.stackexchange.com/questions/432785/how-can-i-generate-customized-smart-diagrams – samcarter_is_at_topanswers.xyz Jun 27 '23 at 15:13
  • I had a look at the smartdiagram package, before. Seems to be rather bound to certain diagrams, so I don't see how I could easily create such a graphic with it. That's why I mentioned TikZ as the most likely way to go. – clel Jun 27 '23 at 15:51
  • TikZ will certainly work. Have a look at the TikZ user guide. It has a good tutorial with many examples. – samcarter_is_at_topanswers.xyz Jun 27 '23 at 15:54
  • Thanks for linking the possible duplicates. Some are just very different diagrams, so not really duplicates, but some also seem very similar. I'll have a look, although the solutions there don't seem that great, either, and don't look related (especially in regards of quality) to the posted examples. – clel Jun 27 '23 at 15:54
  • "Some are just very different diagrams": so are your images. IMHO your question is way to broad – samcarter_is_at_topanswers.xyz Jun 27 '23 at 15:55
  • Both have a central node on the left (one invisible, one visible), and three elements arranged around it on the right. These three elements then have text assigned to them. So not too different, IMHO ;) – clel Jun 27 '23 at 15:59
  • If that's all what is required, a simple mindmap should do – samcarter_is_at_topanswers.xyz Jun 27 '23 at 16:03
  • That wouldn't give the required style, I fear. – clel Jun 27 '23 at 16:12
  • 1
    You question is about "nice three (or n) points graphic like ..." and you posted two variants which is, by the very nature of such questions, not easy to answer. There is not a "one code fits all" solution for this and the closest I can think of is the (already mentioned) mindmaps library for TikZ. Of course, the default style of such mindmaps would need adjustments. – Jasper Habicht Jun 27 '23 at 17:55
  • Thinking about it again, it might be correct, as mindmap makes circular arrangements pretty easy, so could have been the best starting point. For now, I came up with a simpler (and less powerful) solution. Possibly I (or somebody else) will revisit this and build a solution based on the mindmap library that is more versatile. – clel Jun 27 '23 at 18:01

1 Answers1

5

Done (thanks for the references to similar problems in the comments).

This is a rather basic example and can probably be adjusted to fit a broader set of applications. For now, it's a good start, though.

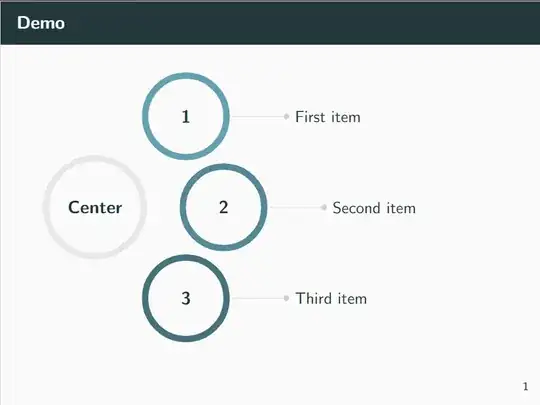
\documentclass{beamer}
\usetheme{metropolis}
\usepackage{adjustbox}
\usepackage{tikz}
\usetikzlibrary{positioning,arrows.meta}
% Base color for diagrams
\definecolor{diagrambasecolor}{HTML}{65a0b0}
\begin{document}
\begin{frame}{Demo}
    \begin{adjustbox}{max width=\textwidth}
        \begin{tikzpicture}[
                bigcircle/.style={ % style for the circles
                        node distance=22pt,
                        text width=1.6cm, % diameter
                        align=center, % center align
                        line width=1.5mm, % thickness of border
                        draw, % draw the border
                        circle, % shape
                        font=\bfseries\large % font type and size
                    },
                description/.style={
                        node distance=40pt
                    }
            ]
            \node [bigcircle,text width=2cm,draw=black!10] (center) {Center};
        \node [bigcircle,draw=diagrambasecolor,above right=of center] (subcircle1) {1};
        \node [description,right=of subcircle1] (description1) {First item};

        \node [bigcircle,draw=diagrambasecolor!85!black,right=of center] (subcircle2) {2};
        \node [description,right=of subcircle2] (description2) {Second item};

        \node [bigcircle,draw=diagrambasecolor!70!black,below right=of center] (subcircle3) {3};
        \node [description,right=of subcircle3] (description3) {Third item};

        % Draw lines towards the item descriptions
        \draw [-Circle,black!20,shorten <=2pt]
        (subcircle1) edge (description1)
        (subcircle2) edge (description2)
        (subcircle3) edge (description3);
    \end{tikzpicture}
\end{adjustbox}

\end{frame} \end{document}

Result: Result

clel
  • 325
  • That's a nice start actually! The mindmaps library would require you to overwrite quite a few styles, so just positioning a few nodes is probably indeed easier. You could make use of polar coordinates here, placing the "Center" node at (0:0) and the others at (45:3), (0:3) and (-45:3). The output would be very similar, but polar coordinates would make it easier to place, for example, four or more circles. – Jasper Habicht Jun 27 '23 at 18:07
  • Ah great! I looked for such a thing before, but didn't find polar coordinates. Thanks for the hint! – clel Jun 27 '23 at 20:34