From the images in the question, it is not really simple to understand how they should look like. I suggest using a graphic editor, if you do not plan to explore Tikz further and then saving it as pdf. For example a very good free and open-source graphics editor can be Inkscape or GIMP.
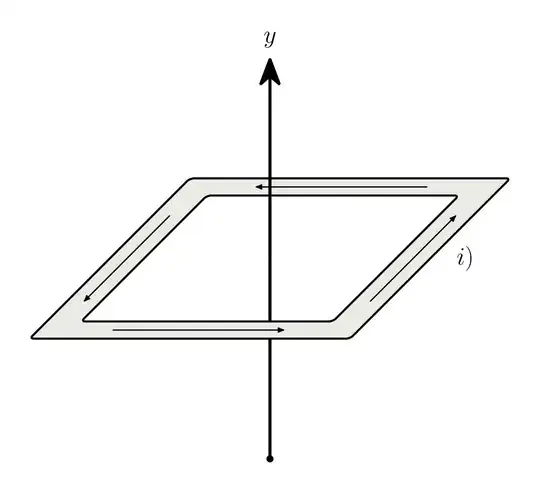
However here are the possible solutions. For the first figure:
\documentclass[tikz, border = 1cm]{standalone}
\usetikzlibrary{positioning, arrows.meta}
\definecolor{custom}{RGB}{234,234,230}
% square
\def\a{5}
\def\t{0.6}
% arrows
\def\l{3}
% axis
\def\axis{7}
\begin{document}
\begin{tikzpicture}
[x={(1cm,0cm)}, y={(0cm,1cm)}, z={(-0.5cm,-0.5cm)}, even odd rule]
    % axis below
    \draw[line width = 3pt, fill] (0,-\axis,0) circle (2pt) -- (0,0,0);
    % circuit
    \filldraw[fill=custom, line width = 2pt, rounded corners]
    (\a+\t,0,-\a-\t) -- (\a+\t,0,\a+\t) -- (-\a-\t,0,\a+\t) -- (-\a-\t,0,-\a-\t) -- cycle
    (\a-\t,0,-\a+\t) -- (\a-\t,0,\a-\t) -- (-\a+\t,0,\a-\t) -- (-\a+\t,0,-\a+\t) -- cycle;
    % arrows
    \draw[-{Latex[round]},very thick] (\l,0,-\a) -- (-\l,0,-\a);
    \draw[-{Latex[round]},very thick] (-\l,0,+\a) -- (\l,0,+\a);
    \draw[-{Latex[round]},very thick] (\a,0,\l) -- (\a,0,-\l);
    \draw[-{Latex[round]},very thick] (-\a,0,-\l) -- (-\a,0,+\l);
    % axis above
    \draw[-{Stealth[round, scale = 2]}, line width = 3pt]
    (0,0,0) -- (0,\axis,0) node [above = 0.2] {\Huge $y$};
    % annotation
    \path (\a+2*\t,0,0) node [right = 0.2] {\Huge $i)$};
\end{tikzpicture}
\end{document}
Here I used \def (a TeX primitive command probably avoidable in this case) to determine some lengths.
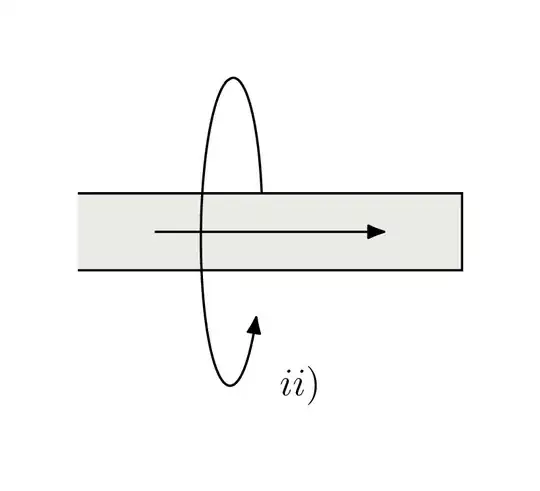
For the second figure:
\documentclass[tikz, border = 1cm]{standalone}
\usetikzlibrary{positioning, arrows.meta}
\definecolor{custom}{RGB}{234,234,230}
\begin{document}
\begin{tikzpicture}
[x={(1cm,0cm)}, y={(0cm,1cm)}, z={(0.2cm,0.05cm)}]
    \draw[domain = 0:pi/2,smooth,thick]
    plot(0,{2sin(\x r)},{2cos(\x r)});
    \filldraw[thick, fill = custom]
    (-2,0.5,0) -- (3,0.5,0) -- (3,-0.5,0) -- (-2,-0.5,0);
    \draw[domain = pi/2:2pi-pi/5,smooth,thick,-{Latex[round,scale=1.2]}]
    plot(0,{2sin(\x r)},{2*cos(\x r)});
    \draw[thick,-{Latex[round,scale=1.2]}]
    (-1,0,0) -- (2,0,0);
    \path (0,-2,0) node [right = 0.5] {\Large $ii)$};
\end{tikzpicture}
\end{document}


please do this for meservice. So show what you have tried, The first one can almost just be traced. I would not even bother "getting the 3D effect right" – daleif Nov 06 '23 at 15:51