I had better luck looking for examples of how to do this, which I found interesting. Within the code you can find the links to the preceding examples.
RESULT:
MWE:
\documentclass[tikz,border=0.5cm]{standalone}
\usetikzlibrary{decorations.pathmorphing,decorations.markings,intersections}
%this code is from Guilherme Zanotelli in a "short" explanation in https://tex.stackexchange.com/a/333824/154390 [start]
\newcommand\bonusspiral{} % just for safety
% \bonusspiraldraw options(start angle:end angle)(start radius:final radius)[revolutions]
\def\bonusspiral#1(#3:#4)(#5:#6)[#7]{
\pgfmathsetmacro{\domain}{#4+#7360}
\pgfmathsetmacro{\growth}{180(#6-#5)/(pi(\domain-#3))}
\draw [#1,
shift={(#2)},
domain=#3pi/180:\domainpi/180,
variable=\t,
name path=plotA,
%smooth,
samples=int(\domain/5)] plot ({\t r}: {#5+\growth\t-\growth#3pi/180});
}
%this code is from Frunobulax https://tex.stackexchange.com/a/445690/154390
\makeatletter
\pgfset{
/pgf/decoration/randomness/.initial=2,
/pgf/decoration/wavelength/.initial=100
}
\pgfdeclaredecoration{sketch}{init}{
\state{init}[width=0pt,next state=draw,persistent precomputation={
\pgfmathsetmacro\pgf@lib@dec@sketch@t0
}]{}
\state{draw}[width=\pgfdecorationsegmentlength,
auto corner on length=\pgfdecorationsegmentlength,
persistent precomputation={
\pgfmathsetmacro\pgf@lib@dec@sketch@t{mod(\pgf@lib@dec@sketch@t+pow(\pgfkeysvalueof{/pgf/decoration/randomness},rand),\pgfkeysvalueof{/pgf/decoration/wavelength})}
}]{
\pgfmathparse{sin(2\pgf@lib@dec@sketch@tpi/\pgfkeysvalueof{/pgf/decoration/wavelength} r)}
\pgfpathlineto{\pgfqpoint{\pgfdecorationsegmentlength}{\pgfmathresult\pgfdecorationsegmentamplitude}}
}
\state{final}{}
}
\tikzset{pencildraw/.style={decorate,decoration={sketch,segment length=1pt,amplitude=2pt}}}
\makeatother
\begin{document}
\begin{tikzpicture}[
Ina/.style={
draw,
postaction={
decorate,
decoration={
markings,
mark=at position #1 with {
\fillxscale=-1,xshift=-1pt -- (90+50:4pt) -- (180:2pt) -- (270-50:4pt);
}
}
}
}
]
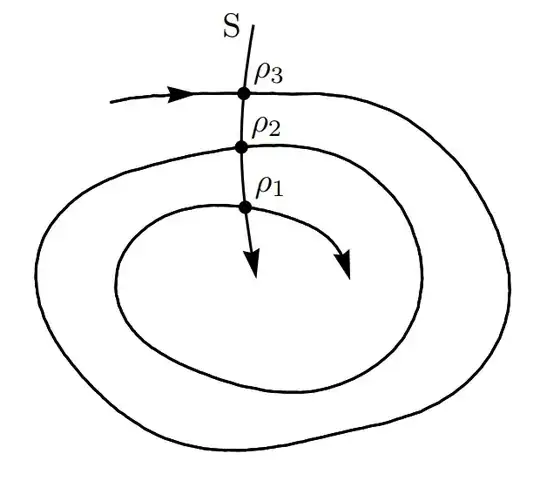
%Start drawing the thing.
% First spiral that starst from 15 at radious 1 and ends at 120 at radious 3 in two revolutions.
\bonusspiralthick,yscale=0.7,pencildraw,Ina=0.97,postaction={Ina=0}(15:120)(1:3)[2]
\drawthick,Ina=0,name path=plotB to [out=100,in=-100] ++ (0,2.5) node[anchor=0]{S};
\fill [name intersections={of=plotA and plotB, name=E, total=\t}][black]
\foreach \s in {1,2,...,\t}{(E-\s) circle (2pt) node[inner sep=0,label={[label distance=-0.2em]45:$\rho_\s$}]{}};
\end{tikzpicture}
\end{document}
ADDENDUM:
To reverse the enumeration I use an additional counter and change the ordering of the counter. \foreach \s [count=\ss from 1]in {\t,...,2,1} Keep in mind that when adapting the spiral it was drawn from the inside out, for that reason the arrows are inverted with xscale=-1, and the shift is used so that it has a better finish when adapting to the curves. The code allows you to expand the result even with more nodes, all thanks to the \bonusspiral macro
NEW RESULT:

NEW MWE:
\documentclass[tikz,border=0.5cm]{standalone}
\usetikzlibrary{decorations.pathmorphing,decorations.markings,intersections}
%this code is from Guilherme Zanotelli  in a "short" explanation in https://tex.stackexchange.com/a/333824/154390 [start]
\newcommand\bonusspiral{} % just for safety
% \bonusspiraldraw options(start angle:end angle)(start radius:final radius)[revolutions]
\def\bonusspiral#1(#3:#4)(#5:#6)[#7]{
    \pgfmathsetmacro{\domain}{#4+#7360}
    \pgfmathsetmacro{\growth}{180(#6-#5)/(pi(\domain-#3))}
    \draw [#1,
    shift={(#2)},
    domain=#3pi/180:\domainpi/180,
    variable=\t,
    name path=plotA,
    %smooth,
    samples=int(\domain/5)] plot ({\t r}: {#5+\growth\t-\growth#3pi/180});
}
%this code is from Frunobulax https://tex.stackexchange.com/a/445690/154390
\makeatletter
\pgfset{
    /pgf/decoration/randomness/.initial=2,
    /pgf/decoration/wavelength/.initial=100
}
\pgfdeclaredecoration{sketch}{init}{
    \state{init}[width=0pt,next state=draw,persistent precomputation={
        \pgfmathsetmacro\pgf@lib@dec@sketch@t0
    }]{}
    \state{draw}[width=\pgfdecorationsegmentlength,
    auto corner on length=\pgfdecorationsegmentlength,
    persistent precomputation={
        \pgfmathsetmacro\pgf@lib@dec@sketch@t{mod(\pgf@lib@dec@sketch@t+pow(\pgfkeysvalueof{/pgf/decoration/randomness},rand),\pgfkeysvalueof{/pgf/decoration/wavelength})}
    }]{
        \pgfmathparse{sin(2\pgf@lib@dec@sketch@tpi/\pgfkeysvalueof{/pgf/decoration/wavelength} r)}
        \pgfpathlineto{\pgfqpoint{\pgfdecorationsegmentlength}{\pgfmathresult\pgfdecorationsegmentamplitude}}
    }
    \state{final}{}
}
\tikzset{pencildraw/.style={decorate,decoration={sketch,segment length=1pt,amplitude=2pt}}}
\makeatother
\begin{document}
    \begin{tikzpicture}[
        Ina/.style={
            draw,
            postaction={
                decorate,
                decoration={
                    markings,
                    mark=at position #1 with {
                        \fillxscale=-1,xshift=-1pt -- (90+50:4pt) -- (180:2pt) -- (270-50:4pt);
                    }
                }
            }
        }
    ]
    %Start drawing the thing.
    % First spiral is used as workspace a spiral that starts from 90 at radious 1 and ends at 90 at radious 6.
    \bonusspiralthick,yscale=0.7,pencildraw,Ina=0.98,postaction={Ina=0}(15:120)(1:5)[4]

    \drawthick,Ina=0,name path=plotB to [out=100,in=-100] ++ (0,4) node[anchor=0]{S};
    \fill [name intersections={of=plotA and plotB, name=E, total=\t}][black]
    \foreach \s [count=\ss from 1]in {\t,...,2,1}{(E-\ss) circle (2pt) node[inner sep=0,label={[label distance=-0.2em]45:$\rho_\s$}]{}};

    \end{tikzpicture}
\end{document}


coordinate (X)is defined inside the\ARCmacro. It can be used by Tikz in macro ÀLfor some reason. However, it's not clear to me if and how these 3 coordinates created inside your tabular are preserved. // So a SOLUTION might be to look fortikzmarkexamples on this site, set such tikzmarks withX` and overlay an other tikzpicture, probably below your tabular. // CONCLUSION: All in all it looks like much effort to me with little effect and alternative ways to obtain easier what you want with cleaner code. – MS-SPO Mar 16 '24 at 12:30