I don't know how to draw this by LaTeX.


I don't know how to draw this by LaTeX.
It will benefit you more if you read the pgf manual, especially if you have to draw more of these figures in the future. The manual gives detailed examples on how to use tikz to draw your LaTeX figures.
I assume that you have some knowledge of LaTeX. If you don't, then, on this site, you may start with What is the best book to start learning LaTeX?.
Let's start with some tikz basics and fit them with your question.
We will use your first figure in this demonstration. We can assign coordinates by using the \coordinate command. We can automate the assigning of coordinates but we shall not do that for the vertices of the polygon. We can type something like the following for the first three vertices:
\begin{tikzpicture}
% Specify the coordinates
\coordinate (A1) at (0,0);
\coordinate (A2) at (1.5,1);
\coordinate (A3) at (3,0);
\end{tikzpicture}
Notice that if you try to compile your document, no figure will appear. Don't worry, you have just assigned the coordinates but you have not done anything to tell tikz to draw your figure.
You can now draw a segment connecting (A1) to (A2) and (A2) to (A3) by writing \draw (A1) -- (A2); and \draw (A2)--(A3);. So you now have
\begin{tikzpicture}
% Specify the coordinates
\coordinate (A1) at (0,0);
\coordinate (A2) at (1.5,1);
\coordinate (A3) at (3,0);
\draw (A1) -- (A2);
\draw (A2)--(A3);
\end{tikzpicture}
or alternatively, you can write
\begin{tikzpicture}
% Specify the coordinates
\coordinate (A1) at (0,0);
\coordinate (A2) at (1.5,1);
\coordinate (A3) at (3,0);
\draw (A1) -- (A2)--(A3);
\end{tikzpicture}
and you get the following figure.

To draw the labels, you have to use the \node command with the proper positioning options like left, right, below, above, above left, above, right, below left, below right as in the following code.
\begin{tikzpicture}
% Specify the coordinates
\coordinate (A1) at (0,0);
\coordinate (A2) at (1.5,1);
\coordinate (A3) at (3,0);
\draw (A1) -- (A2);
\draw (A2) -- (A3);
\node [left] at (A1) {$A_1$};
\node [above] at (A2) {$A_2$};
\node [right] at (A3) {$A_3$};
\end{tikzpicture}
which gives you

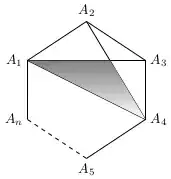
Here is the polygon with labels.
\begin{tikzpicture}
% Specify the coordinates
\coordinate (A1) at (0,0);
\coordinate (A2) at (1.5,1);
\coordinate (A3) at (3,0);
\coordinate (A4) at (3,-1.5);
\coordinate (A5) at (1.5,-2.5);
\coordinate (An) at (0,-1.5);
\draw (An) -- (A1) -- (A2) -- (A3) -- (A4) -- (A5);
\draw [dashed] (A5) -- (An);
\node [left] at (A1) {$A_1$};
\node [above] at (A2) {$A_2$};
\node [right] at (A3) {$A_3$};
\node [right] at (A4) {$A_4$};
\node [below] at (A5) {$A_5$};
\node [left] at (An) {$A_n$};
\end{tikzpicture}

We can determine the intersection with
\path [name path = A2--A4,draw] (A2) -- (A4);
\path [name path = A1--A3,draw] (A1) -- (A3);
\coordinate [name intersections={of= A1--A3 and A2--A4,by=intersect-1}]; % the intersection is named *intersect-1*
To add the shading we write
\shade (A1) -- (intersect-1) -- (A4) -- cycle;
Putting it all together we have:
\begin{tikzpicture}
% Specify the coordinates
\coordinate (A1) at (0,0);
\coordinate (A2) at (1.5,1);
\coordinate (A3) at (3,0);
\coordinate (A4) at (3,-1.5);
\coordinate (A5) at (1.5,-2.5);
\coordinate (An) at (0,-1.5);
\draw (A1) -- (A4);
\draw (An) -- (A1) -- (A2) -- (A3) -- (A4) -- (A5);
\draw [dashed] (A5) -- (An);
\node [left] at (A1) {$A_1$};
\node [above] at (A2) {$A_2$};
\node [right] at (A3) {$A_3$};
\node [right] at (A4) {$A_4$};
\node [below] at (A5) {$A_5$};
\node [left] at (An) {$A_n$};
% determine the intersection and apply the shading
\path [name path = A2--A4,draw] (A2) -- (A4);
\path [name path = A1--A3,draw] (A1) -- (A3);
\coordinate [name intersections={of= A1--A3 and A2--A4,by=intersect-1}];
\shade (A1) -- (intersect-1) -- (A4) -- cycle;
\end{tikzpicture}
We can shorten the code by using \foreach and a technique for placing the nodes that I learned from Peter Grill. Note
\documentclass[tikz]{standalone}

\usetikzlibrary{calc,intersections}

\begin{document}
\begin{tikzpicture}
% Specify the coordinates
\coordinate (A1) at (0,0);
\coordinate (A2) at (1.5,1);
\coordinate (A3) at (3,0);
\coordinate (A4) at (3,-1.5);
\coordinate (A5) at (1.5,-2.5);
\coordinate (An) at (0,-1.5);
\coordinate (center) at ($(A1)!0.5!(A4)$);
% Draw the sides of the polygon
\draw (An) -- (A1) -- (A2) -- (A3) -- (A4) -- (A5);
\draw [dashed] (A5) -- (An);
% draw nodes
\foreach \x in {1,2,3,4,5,n}
    \coordinate (AO\x) at ($(A\x)-(center)$); % defines the coordinates relative to the (center) coordinate.
\foreach \x in {1,2,3,4,5,n}
    \node at ($(center)+1.15*(AO\x)$) {$A_{\x}$}; % You can tweak 1.5 into a value that suits you.
\path [name path = A2--A4,draw] (A2) -- (A4);
\path [name path = A1--A3,draw] (A1) -- (A3);
\coordinate [name intersections={of= A1--A3 and A2--A4,by=intersect-1}];
\shade (A1) -- (intersect-1) -- (A4) -- cycle;
\draw (A1) -- (A4);
\end{tikzpicture}
\end{document}

Just for fun with PSTricks.

\documentclass[pstricks,border=20pt]{standalone}
\usepackage{pst-eucl}
\begin{document}
\begin{pspicture}[showgrid=false](6,6)
    % declare the points, specify the labels and the labels' positions.
    \pstGeonode[PosAngle={180,90,0,-30,-90,-135}]
        (0,4){A_1}
        (3,6){A_2}
        (6,4){A_3}
        (5.5,2){A_4}
        (2,0){A_5}
        (0,0.5){A_n}
    % specify the intersection point between line A1A3 and A2A4, name the intersection point I.
    \pstInterLL[PointName=none,PointSymbol=none]{A_1}{A_3}{A_2}{A_4}{I}
    % fill the inner region
    \pspolygon[fillstyle=vlines](A_1)(I)(A_4)
    % construct the remaining inner lines
    \pstLineAB{A_2}{I}% you can also use \psline{A_2}{I} instead.
    \pstLineAB{A_3}{I}% you can also use \psline{A_3}{I} instead.
    % construct the outer lines
    \psline
        ([nodesep=5pt]{A_5}A_n)
        (A_n)
        (A_1)
        (A_2)
        (A_3)
        (A_4)
        (A_5)
        ([nodesep=5pt]{A_n}A_5)
    % construct a dashed line
    \psline[linestyle=dashed]
        ([nodesep=5pt]{A_n}A_5)
        ([nodesep=5pt]{A_5}A_n)
\end{pspicture}
\end{document}
The construction steps are summarized as follows,


\documentclass[pstricks,border=20pt]{standalone}
\usepackage{pst-eucl}
\begin{document}
\begin{pspicture}[showgrid=false](6,6)
    \pstGeonode[PosAngle={180,90,0,0,-30,-90,-135}]
        (0,4){A_1}
        (3,6){A_2}
        (5,5){A_3}
        (6,3){A_4}
        (4.5,1.5){A_5}
        (2,0){A_6}
        (0,0){A_n}
    % fill the inner regions with even-odd rule.
    \pspolygon[fillstyle=eofill,fillcolor=gray](A_1)(A_4)(A_2)(A_5)(A_3)
    \psline(A_1)(A_5)
    \psline
        ([nodesep=5pt]{A_6}A_n)
        (A_n)
        (A_1)
        (A_2)
        (A_3)
        (A_4)
        (A_5)
        (A_6)
        ([nodesep=5pt]{A_n}A_6)
    \psline[linestyle=dashed]
        ([nodesep=5pt]{A_n}A_6)
        ([nodesep=5pt]{A_6}A_n)
\end{pspicture}
\end{document}
The construction steps are summarized as follows,


\documentclass[pstricks,border=20pt]{standalone}
\usepackage{pst-eucl}
\usepackage{multido,fp}

\begin{document}
\begin{pspicture}[showgrid=false](-3,-3)(3,3)
    % declare the points, specify the labels and the labels' positions.
    \multido{\n=180+45,\i=1+1}{7}{\pstGeonode[PosAngle=-\n](3;-\n){A_\i}}
    \pstGeonode[PosAngle=-135](3;-135){A_n}
    \pscustom
    {
        \moveto([nodesep=5pt]{A_7}A_n)
        \lineto(A_n)
        \multido{\i=1+1}{7}{\lineto(A_\i)}
        \lineto([nodesep=5pt]{A_n}A_7)
    }
    \psline[linestyle=dashed]([nodesep=5pt]{A_n}A_7)([nodesep=5pt]{A_7}A_n)
    % specify the intersection points.
    \bgroup
        \psset{PointName=none,PointSymbol=none}
        \pstInterLL{A_1}{A_4}{A_2}{A_5}{P}
        \pstInterLL{A_1}{A_4}{A_3}{A_6}{Q}
        \pstInterLL{A_2}{A_5}{A_3}{A_6}{R}
    \egroup
    % fill the shaded region.
    \pspolygon[fillstyle=solid,fillcolor=yellow](P)(Q)(R)
    % construct the remaining lines.
    \multido{\ix=1+1}{4}
    {
        \FPeval\N{round(5-\ix:0)}
        \FPeval\Start{round(\ix+2:0)}
        \multido{\iy=\Start+1}{\N}{\psline(A_\ix)(A_\iy)}
    }
\end{pspicture}
\end{document}
:)
– hpesoj626
Jan 03 '13 at 23:08
For this type of diagram you really need to consider what the goal is. How much flexibility do you want to have:
Questions like this will have an effect on the final solution. But before you can even begin to think about adding flexibility you need to be able to draw one of them. Here I have used fixed points so that this is easier to follow, but once you understand how this works, you can come up with an algorithm to automate this further perhaps generating the locations of the points.
Define the points:
Best to first define all the coordinates we need using the \coordinate (<node_name>)at (<x>,<y>) syntax so that we can easily makes changes later if needed.
\coordinate (A1) at (0,4);
\coordinate (A2) at (3,6);
    ...
Label the nodes:
To label the points we place a node at each vertex:
\node [left ] at (A1) {$A_1$};
\node [above] at (A2) {$A_2$};
    ...
Hmm, this seems a bit tedious to list out all the points. The only thing different between each node, is where it is placed relative to the point and the label. So, we can use a \foreach to simplify things:
\foreach \Index/\Position in {1/left, 2/above, 3/above right, 4/right, 5/below right, 6/below, n/left} {
    \node [\Position] at (A\Index) {$A_{\Index}$};
}%
Draw the Lines:
To draw the lines we simply connect each of the points:
\draw (An) -- (A1) -- (A2) -- (A3) -- (A4) -- (A5) -- (A6);
The draw command accepts an optional parameter to control the line styles. For the dotted line we provide the dotted option:
\draw [dotted] (An) -- (A6);
So, now we have the basic shape:

Similarly, draw the other lines:
\draw [gray, ultra thick]
    (A1) -- (A3)
    (A2) -- (A4)
    (A1) -- (A4);

Intersections:
To automatically determine the points of intersections you could use the intersections library.
\fill [fill=red!20, draw=black, ultra thick, name intersections={of=A1A3 and A2A4}]
    (A1) -- (intersection-1) -- (A4) -- cycle;
which yields:

Non-Solid Line Style:
As was pointed out in the comments, the included images had a combination dashed/dotted line. You could define a custom style for that (which would warrant a separate question), but you could also use the tikz's calc library to compute points in between the last point and An:
\coordinate (An') at ($(An)!0.30!(A6)$);%  30% along the path from An to A6
\coordinate (A6') at ($(A6)!0.30!(An)$);%  30% along the path from A6 to An
Here I have used points 30% of the way along the path to switch from dotted to dashed. The color highlighting makes this change more apparent and also makes it more obvious which parts of the code produce what:
\draw [ultra thick, blue,   densely dashed] (An)  -- (An');
\draw [ultra thick, orange, loosely dotted] (An') -- (A6');
\draw [ultra thick, blue,   densely dashed] (A6') -- (A6);

line join=round as per How to fix TikZ corners in 3D.\documentclass{article}
\usepackage{tikz}
\usetikzlibrary{intersections}
\usetikzlibrary{calc}
\begin{document}
\begin{tikzpicture}
% Define all the points:
\coordinate (A1) at (0,4);
\coordinate (A2) at (3,6);
\coordinate (A3) at (5,5);
\coordinate (A4) at (6,3);
\coordinate (A5) at (4.5,1.5);
\coordinate (A6) at (2,0);
\coordinate (An) at (0,0);
% Draw the lines
\draw [ultra thick, blue, solid ] (An) -- (A1) -- (A2) -- (A3) -- (A4) -- (A5) -- (A6);
\coordinate (An') at ($(An)!0.30!(A6)$);% 30% along the path from An to A6
\coordinate (A6') at ($(A6)!0.30!(An)$);% 30% along the path from A6 to An
\draw [ultra thick, blue, densely dashed] (An) -- (An');
\draw [ultra thick, orange, dotted ] (An') -- (A6');
\draw [ultra thick, blue, densely dashed] (A6') -- (A6);
% Label the nodes:
\foreach \Index/\Position in {1/left, 2/above, 3/above right, 4/right, 5/below right, 6/below, n/left} {
\node [\Position] at (A\Index) {$A_{\Index}$};
}%
\draw [gray, ultra thick]
[name path=A1A3] (A1) -- (A3)
[name path=A2A4] (A2) -- (A4)
[name path=A1A4] (A1) -- (A4);
\fill [fill=red!20, draw=black, line join=round, ultra thick, name intersections={of=A1A3 and A2A4}]
(A1) -- (intersection-1) -- (A4) -- cycle;
\end{tikzpicture}
\end{document}
\Index/\Position but my shortsightedness/inexperience got the better of me. :)
– hpesoj626
Oct 18 '12 at 04:21
dashed or dotted line was required. The default dotted is as above. I think a custom line style is probably called for based on the given image, but that is a different matter and perhaps warrants a separate question if it is desired.
– Peter Grill
Oct 18 '12 at 05:05
Use any of these two examples as a basis, provided by TeXample:
http://www.texample.net/tikz/examples/polygon-division/ (Eric Détrez)

http://www.texample.net/tikz/examples/cn4-points-of-intersection/ (Hugues Vermeiren)

\coordinate (A1) at (<x>,<y>);. 2. Label the nodes:\node at (A1) {$A_1$};. 3. Draw the lines:\draw (A1) -- (A2), etc. all within a\begin{tikzpicture}...\end{tikzpicture}. The only part left that does require work is the shading and you can use theintersectionslibrary to help with that. – Peter Grill Oct 17 '12 at 16:38\foreachloop to allow you to have one reusable diagram where you can just specify the number of vertices you want and the rest gets computed automatically. But first you need to do the manual diagram to be able to get started. – Peter Grill Oct 17 '12 at 16:39pgfmanual. In your terminal writetexdoc pgf. Of particular interest maybe section2.16– hpesoj626 Oct 18 '12 at 01:17