I want to get sth like:

I have produced the vector images in Adobe Illustrator. I could do the labels (X_3, X_2,..) in there too, but after importing them in latex they wouldn't be consistent with the whole document.
So I am wondering how can I do that.
I thought Tikz could help me. But it produces a new area which whould be under the image, not near it, like: (I am not so familiar with it)
The code:
\documentclass[a4paper,10pt, reqno]{amsbook}
\usepackage{tikz}
\usetikzlibrary{arrows,shapes,trees}
\usepackage{graphicx}
\graphicspath{F:/(some path here)/pdfs/}
\begin{figure}[!htb]
\centering
\includegraphics[width=0.5\textwidth]{fig1c.pdf}
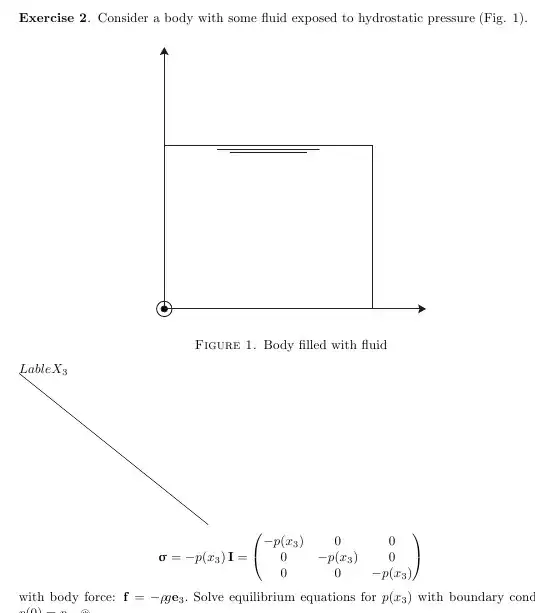
\caption{Body filled with fluid}
\label{fig:digraph}
\end{figure}
\begin{tikzpicture}
%\draw (0,0)--(5,-4);
node[pos=0,above] {$X_3$}
\end{tikzpicture}
\end{document}
So, any ideas?


overlaypackage option :-) – Vahid Nov 20 '12 at 22:21tikz. Basically, as cmhughes illustrates in his answer. – Peter Grill Nov 20 '12 at 22:24