I want to have a table and a figure plotted by \pgfplot in two column but have alignment from above:
\documentclass[a4paper,10pt]{article}
\usepackage[utf8x]{inputenc}
\usepackage{tikz,pgfplots,filecontents}
\usetikzlibrary{shapes,shadows,arrows,matrix,trees,mindmap,backgrounds,automata,shapes.arrows}
%opening
\begin{document}
\begin{tabular}{ll}
{\footnotesize
\begin{tikzpicture}
\node (table) [inner sep=0pt,left]
{
\begin{tabular}{l|l|l|l|l|l|l}
& \multicolumn{1}{l|}{$p = 1$} & \multicolumn{1}{l|}{$p = 2$} &\multicolumn{1}{l|}{$p = 4$} &
\multicolumn{1}{l|}{$p = 8$} & \multicolumn{1}{l|}{$p = 16$} & \multicolumn{1}{l}{$p = 32$} \\
$n$ & \multicolumn{1}{l|}{t[s]} & \multicolumn{1}{l|}{t[s]} & \multicolumn{1}{l|}{t[s]} &
\multicolumn{1}{l|}{t[s]} & \multicolumn{1}{l|}{t[s]} &
\multicolumn{1}{l}{t[s]}
\\\hline
$2^{12}$ & 2.15 & 1.25 & 0.68 & 0.55 & 0.47 & 0.46 \\
$2^{13}$ & 6.13 & 3.41 & 1.32 & 0.91 & 0.68 & 0.56 \\
$2^{14}$ & 14.4 & 7.72 & 3.46 & 1.73 & 1.09 & 0.79 \\
$2^{15}$ & 30.1 & 16.0 & 8.10 & 4.30 & 2.09 & 1.26 \\
$2^{16}$ & 71.3 & 37.7 & 16.61 & 9.70 & 5.23 & 2.43 \\
$2^{17}$ & 175 & 91.7 & 39.45 & 20.18 & 11.61 & 6.01 \\
$2^{18}$ & 355 & 226.8 & 184.3 & 95.41 & 48.65 & 24.41 \\
$2^{19}$ & 719 & 369.9 & 191.8 & 130.1 & 57.12 & 26.54 \\
$2^{20}$ & 1435 & 722.7 & 380.5 & 237.5 & 153.7 & 62.34 \\
\end{tabular}
};
\draw [rounded corners=0.6em] (table.north west) rectangle (table.south east);
\end{tikzpicture}
}
&
\begin{filecontents}{SpRk.dat}
nprocs N12 N13 N14 N15 N16 N17 N18 N19 N20
1 1 1 1 1 1 1 1 1 1
2 1.7159 1.7971 1.8688 1.8832 1.8912 1.9076 1.9244 1.9343 1.9854
4 3.1618 4.6299 4.1676 3.7228 4.2932 4.4359 3.7175 3.721 3.7708
8 3.8949 6.7511 8.3594 7.0142 7.3493 8.6702 7.2912 5.485 6.0428
16 4.5648 9.0015 13.193 14.4 13.632 15.077 14.53 12.496 9.3358
32 4.6943 10.907 18.184 23.921 29.37 29.133 26.555 26.895 23.016
\end{filecontents}
\pgfplotstableread{SpRk.dat}{\SpRk}
\pgfplotsset{
small,
tick label style={font=\tiny},
label style={font=\small},
legend style={font=\tiny},
anchor=center
}
\begin{tikzpicture}[scale=1.0,yshift=-2cm]
\begin{axis}[
legend style={at={(0.01,1.0)},
anchor=north west},
ymajorgrids=true,
ytick={1,5,10,15,20,25,32},
xtick={1,5,10,15,20,25,32},
xticklabels={1,2,4,8,16,32},
yticklabels={1,2,4,8,16,32},
xlabel= {$\#$ of processors},
%ylabel= Speedup,
]
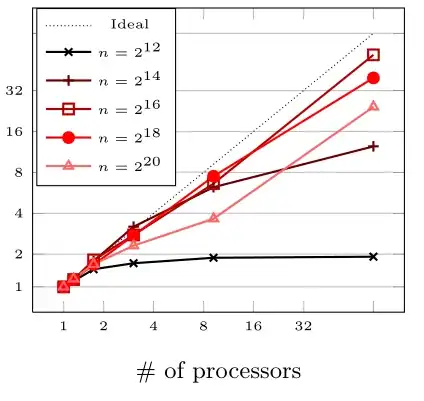
\addplot[black,densely dotted] plot coordinates {
(1,1)
(2,2)
(4,4)
(8,8)
(16,16)
(32,32)
};
\addplot [black,thick,mark=x] table [x={nprocs}, y={N12}] {\SpRk};
\addplot [green,thick,mark=+] table [x={nprocs}, y={N14}] {\SpRk};
\addplot [purple,thick,mark=square] table [x={nprocs}, y={N16}] {\SpRk};
\addplot [purple,thick,mark=*] table [x={nprocs}, y={N18}] {\SpRk};
\addplot [red, thick,mark=triangle] table [x={nprocs}, y={N20}] {\SpRk};
\legend{Ideal,$n=2^{12}$,$n=2^{14}$,$n=2^{16}$,$n=2^{18}$,$n=2^{20}$}
\end{axis}
\end{tikzpicture}
\end{tabular}%
\end{document}


multicolumncommands if they are all only one column wide? – Benedikt Bauer Dec 17 '12 at 08:56