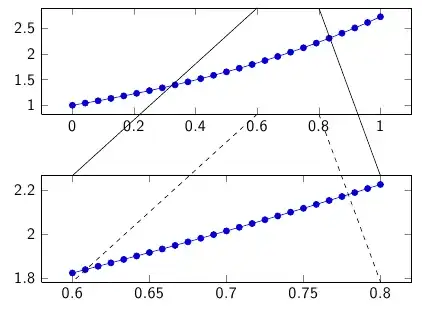
I have two figures that I'd like to connect; both are generated with pgfplots (and in this example, gnuplot). The following works exactly as expected:
\documentclass{beamer}
\usepackage{graphicx}
\usepackage{pgfplots}
\pgfplotsset{compat=1.7}
\begin{document}
\begin{frame}
  \tikzstyle{every picture}+=[remember picture]
  \begin{figure}
    \centering
    \begin{tikzpicture}
      \begin{axis}[height=4cm, width=10cm, enlargelimits = false]
        \addplot gnuplot[id=1, domain=0:1] {exp(x)};
        \coordinate (upper8) at (axis cs:.8,\pgfkeysvalueof{/pgfplots/ymax});
        \coordinate (upper6) at (axis cs:.6,\pgfkeysvalueof{/pgfplots/ymax});
        \coordinate (lower8) at (axis cs:.8,\pgfkeysvalueof{/pgfplots/ymin});
        \coordinate (lower6) at (axis cs:.6,\pgfkeysvalueof{/pgfplots/ymin});
      \end{axis}
    \end{tikzpicture}
  \end{figure}
  \begin{figure}
    \centering
    \begin{tikzpicture}
      \begin{axis}[height=4cm, width=10cm, enlargelimits = false]
        \addplot gnuplot[id=2, domain=.6:.8] {exp(x)};
        \coordinate (no) at (axis cs:.8,\pgfkeysvalueof{/pgfplots/ymax});
        \coordinate (nw) at (axis cs:.6,\pgfkeysvalueof{/pgfplots/ymax});
        \coordinate (so) at (axis cs:.8,\pgfkeysvalueof{/pgfplots/ymin});
        \coordinate (sw) at (axis cs:.6,\pgfkeysvalueof{/pgfplots/ymin});
      \end{axis}
    \end{tikzpicture}
  \end{figure}
  \tikz[overlay] \draw (upper8) -- (no);
  \tikz[overlay] \draw (upper6) -- (nw);
  \tikz[overlay] \draw[dashed] (lower8) -- (so);
  \tikz[overlay] \draw[dashed] (lower6) -- (sw);
\end{frame}
\end{document}
%%% Local Variables:
%%% LaTeX-command: "latex -shell-escape"
%%% End:

As already observed in the answer to another question, ymax does not behave as expected once the (second) plot has a logarithmic axis, though:
\documentclass{beamer}
\usepackage{graphicx}
\usepackage{pgfplots}
\pgfplotsset{compat=1.7}
\begin{document}
\begin{frame}
  \tikzstyle{every picture}+=[remember picture]
  \begin{figure}
    \centering
    \begin{tikzpicture}
      \begin{axis}[height=4cm, width=10cm, enlargelimits = false]
        \addplot gnuplot[id=3, domain=0:1] {exp(x)};
        \coordinate (upper8) at (axis cs:.8,\pgfkeysvalueof{/pgfplots/ymax});
        \coordinate (upper6) at (axis cs:.6,\pgfkeysvalueof{/pgfplots/ymax});
        \coordinate (lower8) at (axis cs:.8,\pgfkeysvalueof{/pgfplots/ymin});
        \coordinate (lower6) at (axis cs:.6,\pgfkeysvalueof{/pgfplots/ymin});
      \end{axis}
    \end{tikzpicture}
  \end{figure}
  \begin{figure}
    \centering
    \begin{tikzpicture}
      \begin{axis}[height=4cm, width=10cm, enlargelimits = false, ymode=log]
        \addplot gnuplot[id=4, domain=.6:.8] {exp(x)};
        \coordinate (no) at (axis cs:.8,\pgfkeysvalueof{/pgfplots/ymax});
        \coordinate (nw) at (axis cs:.6,\pgfkeysvalueof{/pgfplots/ymax});
        \coordinate (so) at (axis cs:.8,\pgfkeysvalueof{/pgfplots/ymin});
        \coordinate (sw) at (axis cs:.6,\pgfkeysvalueof{/pgfplots/ymin});
      \end{axis}
    \end{tikzpicture}
  \end{figure}
  \tikz[overlay] \draw (upper8) -- (no);
  \tikz[overlay] \draw (upper6) -- (nw);
  \tikz[overlay] \draw[dashed] (lower8) -- (so);
  \tikz[overlay] \draw[dashed] (lower6) -- (sw);
\end{frame}
\end{document}
%%% Local Variables:
%%% LaTeX-command: "latex -shell-escape"
%%% End:

So my question is: What should I use with the logarithmic plot if not ymax?
As an aside, when I toyed around with this, I noticed that without the option enlargelimits=false, the connecting lines end up quite far from where they're supposed to go, too; am I doing something wrong? Here's the code:
\documentclass{beamer}
\usepackage{graphicx}
\usepackage{pgfplots}
\pgfplotsset{compat=1.7}
\begin{document}
\begin{frame}
  \tikzstyle{every picture}+=[remember picture]
  \begin{figure}
    \centering
    \begin{tikzpicture}
      \begin{axis}[height=4cm, width=10cm]
        \addplot gnuplot[id=5, domain=0:1] {exp(x)};
        \coordinate (upper8) at (axis cs:.8,\pgfkeysvalueof{/pgfplots/ymax});
        \coordinate (upper6) at (axis cs:.6,\pgfkeysvalueof{/pgfplots/ymax});
        \coordinate (lower8) at (axis cs:.8,\pgfkeysvalueof{/pgfplots/ymin});
        \coordinate (lower6) at (axis cs:.6,\pgfkeysvalueof{/pgfplots/ymin});
      \end{axis}
    \end{tikzpicture}
  \end{figure}
  \begin{figure}
    \centering
    \begin{tikzpicture}
      \begin{axis}[height=4cm, width=10cm]
        \addplot gnuplot[id=6, domain=.6:.8] {exp(x)};
        \coordinate (no) at (axis cs:.8,\pgfkeysvalueof{/pgfplots/ymax});
        \coordinate (nw) at (axis cs:.6,\pgfkeysvalueof{/pgfplots/ymax});
        \coordinate (so) at (axis cs:.8,\pgfkeysvalueof{/pgfplots/ymin});
        \coordinate (sw) at (axis cs:.6,\pgfkeysvalueof{/pgfplots/ymin});
      \end{axis}
    \end{tikzpicture}
  \end{figure}
  \tikz[overlay] \draw (upper8) -- (no);
  \tikz[overlay] \draw (upper6) -- (nw);
  \tikz[overlay] \draw[dashed] (lower8) -- (so);
  \tikz[overlay] \draw[dashed] (lower6) -- (sw);
\end{frame}
\end{document}
%%% Local Variables:
%%% LaTeX-command: "latex -shell-escape"
%%% End:

axis cs:doesn't work with logarithmic axes (it does). Do you have a particular reason for using separatetikzpictures instead of simply putting both the axes and the drawing commands into one? – Jake Feb 15 '13 at 19:53axis cswhen the problem is clearly with ymax. – anonymous Feb 15 '13 at 19:57\only<1-2>,\only<1>, and\only<2>blocks, respectively; that is why I use separate tikzpictures. Maybe the key from http://tex.stackexchange.com/questions/6135/how-to-make-beamer-overlays-with-tikz-node/6155#6155 could be used instead but I expected this to be the easier route. – anonymous Feb 15 '13 at 19:59