Can somebody help me? I try to align two plots horizontally in pgfplots! In the preamble I have:
MWE*
\documentclass[12pt]{article}
\usepackage{pgfplots,subcaption}
\pgfplotsset{ compat=1.7,
dacrip plot/.style={ % Set common styles that can be applied to the axis environment
x=2cm, y=2cm, % Unit vector length
axis lines=middle, % Axis lines go through (0,0)
xtick=\empty, ytick=\empty, % No tick marks
ymin=0, ymax=1.75, % Y axis range
enlargelimits=upper, % Increase upper range a bit
clip=false, % Allow labels to extend beyond the axis
disabledatascaling, % Allow to draw TikZ objects without having to use (axis cs:<x>,<y>)
x label style={anchor=north}, % Alignment of axis labels
y label style={anchor=east},
yticklabel style={align=right}
}
}
\begin{document}
\begin{figure}[!h]\centering
\begin{subfigure}[t]{0.48\textwidth} \centering
\begin{tikzpicture}[baseline]
\begin{axis}[dacrip plot, xlabel=$f$, ylabel=$U$]
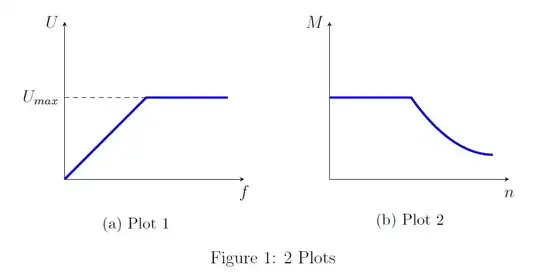
\addplot [blue, ultra thick] coordinates {(0,0) (1,1) (2,1) };
\draw [dashed] (0,1) -- (1,1) node [pos=0, anchor=east] {$U_{max}$};
\end{axis}
\end{tikzpicture}
\subcaption{Plot 1}\label{fig:ufMna}
\end{subfigure}
\begin{subfigure}[t]{0.48\textwidth} \centering
\begin{tikzpicture}[baseline]
\begin{axis}[dacrip plot, xlabel=$n$, ylabel=$M$ ]
\addplot [blue, ultra thick] coordinates {(0,1) (1,1)} parabola [bend at end] (2,0.3);
\end{axis};
\end{tikzpicture}
\subcaption{Plot 2}\label{fig:ufMnb}
\end{subfigure}
\caption{2 Plots}
\label{fig:ufMn}
\end{figure}
\end{document}

The problem is that the x-axis of Plot 2 is to short. Another problem is that the alignment of the x-axis is there, but the captions of the two plots aren't aligned!
***** Modified from OP's snippet
groupplotslibrary: see as reference How to align PGFplot subplots and Using pgfplots, add vertical/horizontal spacing between plots? – Claudio Fiandrino Feb 22 '13 at 08:10\documentclass)? – Jake Feb 22 '13 at 08:19