I would like to apply some complex valued function to some region in the plane, say, a circle of radius $R$ centred at $k$.
How can I do this?
I would like to apply some complex valued function to some region in the plane, say, a circle of radius $R$ centred at $k$.
How can I do this?
Under the interpretation of OP's question as
How do I apply the transformation $w=f(z)$ to a region (e.g. a disk) in the complex plane?
I'd say ParametricPlot[] (which now incorporates the functionality from the old Graphics`ComplexMap` package) would be what you can use:
With[{f = # + 1/# &, center = 1/3 + 3 I/2, radius = 4/3},
 ParametricPlot[
       Through[{Re, Im}[f[center + r Exp[I θ]]]], {r, 0, radius}, {θ, -π, π},
               PlotPoints -> 45, PlotRange -> All]]

I thought the question was to apply a translation to the circle.
Including the option for radius size and location of center of circle:
f[radius_, {x1_, y1_}] :=
DensityPlot[Sin[x]*Sin[y], {x, -12, 12}, {y, -12, 12},
RegionFunction -> Function[{x, y}, (x - x1)^2 + (y - y1)^2 < radius^2],
ColorFunction -> "SunsetColors", GridLines -> {{x1}, {y1}}]

f[2, {5, -3}]
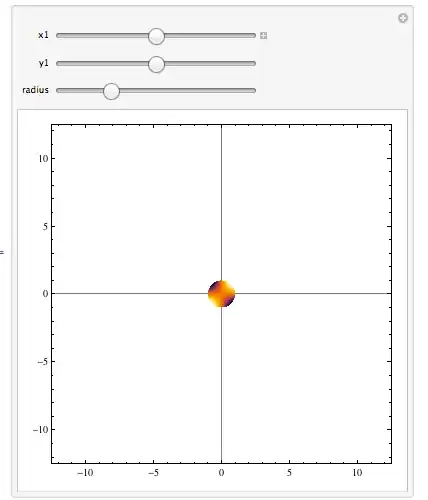
Making this interactive,
Manipulate[ DensityPlot[Sin[x]*Sin[y], {x, -12, 12}, {y, -12, 12},
 RegionFunction -> Function[{x, y}, (x - x1)^2 + (y - y1)^2 < radius^2],
 ColorFunction -> "SunsetColors", GridLines -> {{x1}, {y1}},
 PlotRange -> 15],{{x1, 0}, -10, 10},{{y1, 0}, -10, 10, Slider},{{radius, 1}, 0, 4, Slider}]
Use RegionFunction, like so:
DensityPlot[Sin[3*x]*Cos[4*y], {x, -2, 2}, {y, -2, 2},
 RegionFunction -> Function[{x, y}, x^2 + y^2 < 4]]

There are many ways to represent visually a complex-valued function of a complex variable. Here's another one. (Instead of superimposing the plots of real and imaginary parts, you could make a Row or GraphicsRow of them.
Plot3D[Through[{Re, Im}[ArcSin[x + y I]]], {x, -Pi, Pi}, {y, -Pi, Pi},
      RegionFunction -> Function[{x, y, z}, x^2 + y^2 <= Pi^2],
      MeshFunctions -> {Re[Sqrt[#1 + I #2]] &, Im[Sqrt[#1 + I #2]] &},
      BoxRatios -> {1,1,0.7}]
